Carbon Market Network


Your electricity bill is one of the easiest emissions numbers to find. It is also one of the easiest to get wrong.
Grid factors, renewable certificates, supplier contracts and two reporting methods turn Scope 2 into a puzzle fast. A spreadsheet works for one office. It breaks when you add ten sites in four countries.
That is where scope 2 emissions accounting software helps. The right tool pulls in your energy data, applies the correct emission factors and gives you numbers an auditor can follow.
In this guide, you will meet the top 7 scope 2 emissions accounting software platforms used by companies around the world. You will also learn how Scope 2 accounting works, what is changing in the rules, and how to pick a tool that fits your team.
What Is Scope 2 Emissions Accounting Software?
Scope 2 emissions are the indirect greenhouse gas emissions from the energy you buy. That mostly means electricity. It can also include purchased steam, heat and cooling.
Scope 2 emissions accounting software is a digital tool that collects your energy data, calculates those emissions and reports them in line with the GHG Protocol. Many people also call it carbon accounting software or an emissions management platform.
Most modern platforms cover Scope 1, 2 and 3 together. Scope 2 is often the first place teams start because the data is easier to reach than supply chain data.
What the software actually does
A good platform handles the boring and risky parts of the job:
- Collects data from utility bills, smart meters, landlords and ERP systems
- Applies emission factors for each country, grid region or supplier
- Calculates both methods, location-based and market-based
- Tracks renewable certificates and contracts that reduce your market-based number
- Keeps an audit trail so you can show where every figure came from
- Produces reports for frameworks such as CDP, ESRS, IFRS S2 and California’s SB 253
Who needs it
Any business that buys electricity has Scope 2 emissions. That covers factories, retailers, offices, data centers, hospitals and universities.
The need grows with size. A single shop can manage with a simple calculator. A group with dozens of sites needs software.
Carbon Market Insider Newsletter
Weekly insights on carbon markets, climate policy, carbon credits, and sustainability.
Why Scope 2 Accounting Is Getting Harder
Scope 2 used to feel simple. Take your kilowatt hours, multiply by a grid factor and you are done.
Two things changed that. Companies now buy a lot of renewable energy, and investors want proof that those purchases are real.
Location-based vs market-based reporting
The GHG Protocol asks companies to report Scope 2 in two ways. Each answers a different question.
| Feature | Location-based method | Market-based method |
|---|---|---|
| Core question | What is the average emissions intensity of the grid where I operate? | What emissions come from the energy I chose to buy? |
| Emission factor used | Grid average for the region | Contract, certificate, supplier or residual mix factor |
| Reflects renewable purchases? | No | Yes |
| Main data needed | Energy use plus grid factors | Energy use plus certificates, PPAs and supplier data |
| Best for | Showing physical grid impact | Showing the effect of procurement choices |
Companies that operate in markets where contractual instruments exist are expected to report both figures. That is why dual reporting is a must-have feature in any tool.
The market-based hierarchy
For the market-based method, the GHG Protocol sets an order of preference for emission factors:
- Energy attribute certificates and contracts, such as RECs, Guarantees of Origin and PPAs
- Supplier or utility-specific emission rates
- Residual mix factors, which remove claimed clean energy from the grid mix
- Grid average factors, when nothing better exists
Good software applies this order for you. It also stops you from claiming the same certificate twice.
The rulebook is being revised
The GHG Protocol is reworking its Scope 2 guidance for the first time in a long while. A public consultation drew close to 1,100 responses.
The original draft proposed two big changes. Hourly matching would require clean energy certificates to match your consumption hour by hour. Deliverability would require that the clean power could plausibly reach the grid where you use it.
Companies pushed back hard. Feedback showed low support for both ideas as drafted. Respondents did back measures that ease the move, such as protecting existing contracts and exempting smaller organizations.
The latest update from the GHG Protocol board points to two market-based methods:
- Method 1 would require hourly matching, deliverability and incrementality
- Method 2 would keep the existing rules, but only until a transition date that is still to be set
The details are still open. A further consultation and a joint GHG Protocol and ISO standard are both still ahead. Hourly matching and deliverability are not final requirements today.
Why this matters for your software choice
You do not need to panic. You do need a tool that can grow with the rules.
Here is the practical point. If hourly matching arrives in some form, you will need interval meter data and time-stamped certificates. Platforms that already handle granular energy data will adapt more easily.
Analysts at Watershed, FlexiDAO and Granular Energy modeled the impact. Their analysis suggests a company with 100% annual renewable coverage might reach only about 40% to 65% hourly carbon-free energy. They also estimated that deliverability limits could disqualify 30% to 50% of some unbundled certificate portfolios.
Treat those as modeled estimates, not guarantees. They still show why data quality matters.
How Scope 2 Accounting Works Step by Step
Before you compare tools, it helps to know the workflow the software automates.
- Set your boundary. Decide which sites and entities you control. Use the same approach you use for your wider inventory.
- Collect energy data. Gather electricity, steam, heat and cooling use for every site. Sources include bills, meters and landlord statements.
- Pick location-based factors. Match each site to the right grid factor for its country or region.
- Gather market-based evidence. Collect certificates, PPAs, green tariffs and supplier emission rates.
- Calculate both figures. Multiply energy use by the right factor for each method.
- Review and document. Check for gaps, estimates and double counting. Keep proof for every number.
- Report and track. Send results to disclosure frameworks and track progress against targets.
A simple worked example
The numbers below are made up to show the logic.
A warehouse uses 500,000 kWh of electricity in a year. The local grid factor is 0.40 kg CO2e per kWh.
- Location-based: 500,000 x 0.40 = 200,000 kg, or 200 tonnes CO2e
The company also retires certificates covering 300,000 kWh of renewable power. The remaining 200,000 kWh gets a residual mix factor of 0.50 kg CO2e per kWh.
- Market-based: 200,000 x 0.50 = 100,000 kg, or 100 tonnes CO2e
Same warehouse. Two numbers. Both are valid, and both must be reported clearly.
Now picture doing this across 80 sites, three currencies and a dozen utilities. You can see why people look for software.
Key Features to Look for in Scope 2 Emissions Accounting Software
Not every platform handles Scope 2 equally well. Use this table as a checklist.
| Feature | Why it matters |
|---|---|
| Dual reporting | You need location-based and market-based results side by side |
| Emission factor library | A large, regularly updated library saves research time and reduces errors |
| Certificate and PPA tracking | Lets you apply and retire RECs, Guarantees of Origin and contracts correctly |
| Utility bill and meter integration | Automates data capture and cuts manual entry |
| Interval and hourly data support | Prepares you for more granular accounting rules |
| Audit trail | Shows source, factor and change history for every figure |
| Multi-site and multi-entity roll-ups | Essential for groups with many locations or subsidiaries |
| Framework reporting | Maps your data to CDP, ESRS, IFRS S2, SB 253 and similar rules |
| Target setting and scenarios | Helps you plan renewable purchases and track progress |
| Integrations and APIs | Connects to ERP, finance and building systems |
Questions worth asking every vendor
- Does the tool calculate market-based emissions using the GHG Protocol hierarchy?
- How does it prevent double counting of certificates?
- Can it store interval meter data, and can it use it for hourly analysis?
- How often does it update emission factors, and where do they come from?
- What does the audit trail look like to an external verifier?
- How does it cope with estimates when a utility bill is missing?
- What will it cost once you add sites, users and modules?
Top 7 Scope 2 Emissions Accounting Software Platforms
Here are seven platforms worth a serious look. They differ in size, price and focus, so read the “best for” line first.
Nearly all of them use quote-based pricing. You will need to book a demo to get a number.
1. Watershed
Watershed is a carbon and climate platform built mainly for mid-size and large companies. It covers Scope 1, 2 and 3 and puts a lot of weight on reporting and supplier workflows.
What stands out for Scope 2 is its policy depth. Watershed co-authored the modeling work on proposed GHG Protocol changes with FlexiDAO and Granular Energy. That shows the team follows the hourly matching debate closely.
Strengths
- Enterprise-grade carbon accounting across all scopes
- Strong reporting and supplier engagement features
- Active research on how Scope 2 rule changes affect clean energy buyers
Watch outs
- Third-party estimates put enterprise platforms like Watershed at roughly $50,000 to $250,000 or more per year, so it may be too heavy for small firms
- You need to confirm exactly which hourly and certificate features are live today
Best for: Large companies with serious climate programs and a dedicated sustainability team.
2. Persefoni
Persefoni positions itself as a climate management and accounting platform with finance-style controls. It measures Scope 1, 2 and 3 emissions and produces audit-ready reports.
The company has leaned into AI. It has launched an analytics agent that lets users ask questions about their emissions data in plain language.
Persefoni also has integrations and partnerships with reporting and audit tools such as Workiva and AuditBoard. That helps if your finance and risk teams already use them.
Strengths
- Finance-grade structure with strong auditability
- Works for corporates and financial institutions
- AI assistant for faster questions and analysis
Watch outs
- Reviewers note it is designed mainly around carbon accounting and climate reporting, so broader ESG needs may require other tools
- Plan options, including any free tier, change over time, so check current offers
Best for: Finance-led teams that want audit-ready carbon numbers and tight reporting controls.
3. IBM Envizi
IBM Envizi is an ESG data platform with a dedicated Scope 1 and 2 GHG accounting module. It is one of the more energy-focused options on this list.
The Scope 1 and 2 module reports both market-based and location-based emissions. IBM says the calculation engine uses a library of more than 40,000 emission factors with a factor selection algorithm.
Envizi also offers utility bill analytics and interval meter analytics. Those matter if you want to move toward more granular energy data.
Its renewable energy certificate handling lets you allocate certificates and net out green power in market-based reporting. Recent updates widened Scope 2 reporting to include district heating, cooling and steam.
For teams that do not need a full platform, IBM also sells a self-serve option that runs emissions calculations inside Excel and through an API.
Strengths
- Deep Scope 2 tooling, including certificates, interval data and utility bill analytics
- Large, managed emission factor library
- Flexible entry points, from full platform to Excel and API
Watch outs
- Some reviewers say it takes time and training to use every feature
- Pricing is quote-based and depends on modules
Best for: Energy-intensive or multi-site organizations that want strong utility and meter data handling.
4. Microsoft Sustainability Manager
Microsoft Sustainability Manager sits inside Microsoft Cloud for Sustainability. It lets you calculate and track emissions across scopes inside the Microsoft ecosystem.
For Scope 2, its documentation explains both methods clearly. The location-based method uses average grid factors, such as direct line or regional factors. The market-based method uses contractual factors from certificates, contracts and suppliers.
Microsoft recommends you build a separate emission factor library for each method. That keeps the two results clean. A newer calculation model also processes both Scope 2 results together for the same activity.
There is also a useful real-world angle here. Microsoft itself reports both figures. In its latest environmental data, location-based Scope 2 was about 12 million tonnes CO2e. Market-based Scope 2 was about 2.7 million tonnes, up sharply from roughly 259,000 tonnes the year before.
The gap between those numbers shows why you must report both methods and explain them.
Strengths
- Fits neatly with Microsoft data, Power BI and Azure tools
- Clear separation of location-based and market-based factor libraries
- Good for teams already standardized on Microsoft
Watch outs
- Setup may need technical help or a partner
- Features and licensing evolve, so confirm current options
Best for: Organizations that already run on Microsoft cloud tools and want emissions data close to their other business data.
5. Sweep
Sweep is a Paris-based carbon and ESG data platform founded in 2020. It has earned leader positions in analyst reports from IDC and Verdantix in recent years.
Its structure follows a track, disclose and act approach. The platform treats each emissions calculation like a traceable accounting entry, which helps during audits.
Sweep can import cloud emissions from AWS, including location-based and market-based Scope 2 values. It recommends location-based values by default, though market-based values are supported.
An AI assistant called Sweepy flags data gaps and points out emissions hotspots.
Strengths
- Traceable calculation model that suits audit conversations
- Flexible data structure for complex organizations
- Positioned more accessibly than the biggest enterprise platforms
Watch outs
- Pricing is quote-based, with no free trial listed in some reviews
- Check how deeply it supports certificate tracking for your markets
Best for: Mid-market and growing enterprise teams that want strong carbon expertise bundled with the software.
6. Schneider Electric Resource Advisor
Schneider Electric brings decades of energy management experience to carbon accounting. EcoStruxure Resource Advisor is a cloud platform for tracking energy and sustainability data.
Its big strength is utility data. Schneider’s utility bill team says it processes more than 39 million bills for customers. That kind of scale helps if your energy data lives in messy bills across many regions.
Schneider has also launched Resource Advisor+, an AI-first platform. It starts with a Carbon Performance product and a Supply Chain product. The Carbon Performance product offers GHG Protocol-aligned calculations across Scope 1, 2 and 3. An AI agent called Sera helps users work with the data.
The existing Resource Advisor remains available, so current and new customers have options.
Strengths
- Excellent utility bill and energy data management
- Strong fit for large property portfolios and multi-site operations
- Backed by a large energy and sustainability consulting practice
Watch outs
- Product lines are shifting, so ask which version suits you
- Likely better value for larger organizations than for very small ones
Best for: Companies with many facilities where energy bill data is the main Scope 2 headache.
7. Plan A
Plan A is a European carbon accounting and decarbonization platform. It covers Scope 1, 2 and 3 and also supports reporting and reduction planning.
The company highlights a certified, GHG Protocol-aligned methodology. It connects with ERP and accounting systems, which helps pull in energy and spending data without heavy manual work.
Plan A sells in tiers called Essential, Pro and Enterprise. That makes it easier for a growing company to start small and add features later.
Strengths
- Certified methodology and guided onboarding
- ERP and accounting connections for automatic data intake
- Tiered plans that suit mid-market buyers
Watch outs
- Some small companies find the price steep
- Supplier-driven Scope 3 results depend on supplier participation, so check where you want the most depth
Best for: Mid-market companies, especially in Europe, that want a structured platform with guided setup.
Scope 2 Emissions Accounting Software Comparison Table
Use this snapshot to shortlist two or three tools.
| Platform | Best for | Standout Scope 2 angle | Typical buyer |
|---|---|---|---|
| Watershed | Large climate programs | Policy depth and enterprise reporting | Large global company |
| Persefoni | Finance-led teams | Audit-ready, finance-style controls | Corporate or financial institution |
| IBM Envizi | Energy-heavy portfolios | Interval meter analytics, certificate handling, 40,000+ factors | Multi-site enterprise |
| Microsoft Sustainability Manager | Microsoft-based organizations | Separate factor libraries for each method | Existing Microsoft customer |
| Sweep | Growing mid-market and enterprise | Traceable, ledger-style calculations | Mid-size to large company |
| Schneider Electric Resource Advisor | Facility-rich businesses | Large-scale utility bill management | Property and industrial groups |
| Plan A | Mid-market buyers | Certified methodology and ERP links | Mid-size company |
How to Choose the Right Scope 2 Emissions Accounting Software
The best tool is the one your team will actually use. Follow these steps.
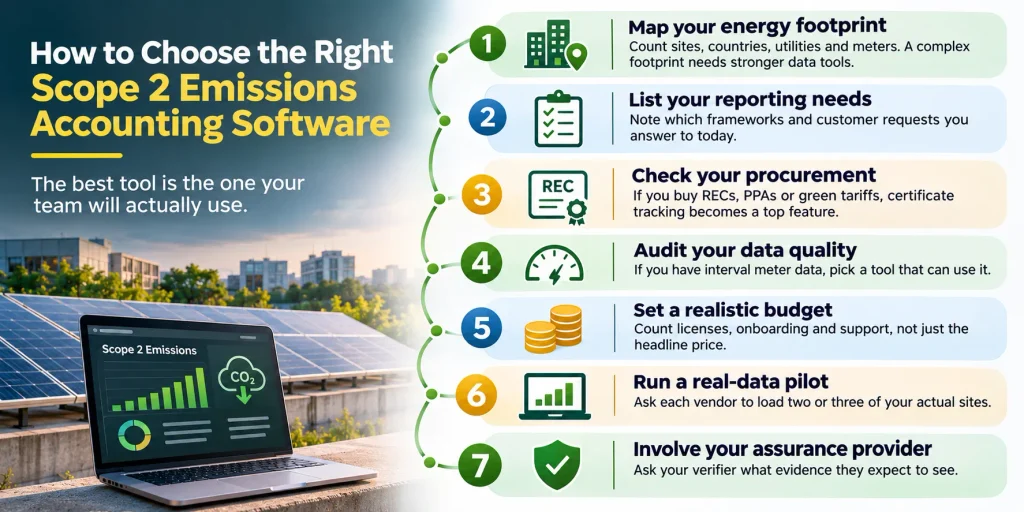
- Map your energy footprint. Count sites, countries, utilities and meters. A complex footprint needs stronger data tools.
- List your reporting needs. Note which frameworks and customer requests you answer to today.
- Check your procurement. If you buy RECs, PPAs or green tariffs, certificate tracking becomes a top feature.
- Audit your data quality. If you have interval meter data, pick a tool that can use it.
- Set a realistic budget. Count licenses, onboarding and support, not just the headline price.
- Run a real-data pilot. Ask each vendor to load two or three of your actual sites.
- Involve your assurance provider. Ask your verifier what evidence they expect to see.
Which tool fits which situation
| Your situation | Features to prioritize |
|---|---|
| One country, a handful of sites | Simple data entry, solid factor library, clear reports |
| Many sites with messy bills | Utility bill automation and strong data validation |
| Big renewable energy buyer | Certificate and PPA tracking, interval data support |
| Finance-led reporting | Audit trails, approvals, links to reporting tools |
| Microsoft or SAP shop | Native integrations with your core systems |
Real-World Examples
Example 1: The multi-site manufacturer
Imagine a manufacturer with 12 plants across Europe, Asia and North America. Each plant has a different utility and a different bill format.
The team once spent weeks each year chasing PDFs. After moving to a platform with automated bill capture, they load data monthly and spot spikes early.
They also keep location-based and market-based numbers side by side. That helps them explain why a plant on a green tariff looks cleaner than its grid.
This scenario is illustrative, but it matches the pain points these tools target.
Example 2: The corporate renewable buyer
Imagine a technology company that buys renewable certificates equal to all of its annual electricity use. On paper, its market-based Scope 2 is near zero.
The Watershed, FlexiDAO and Granular Energy analysis shows why that can hide a gap. Solar certificates may cover daytime use, but night-time demand may still draw from a fossil-heavy grid.
The analysis also points to a public example. A large tech company reported full annual renewable matching, yet only about 64% of its electricity was carbon-free on an hourly basis.
A platform that can model hourly data helps this buyer plan better contracts, whatever the final rules say.
Example 3: The data-center-heavy business
Microsoft’s reported figures show how large the method gap can be for power-hungry operations. Location-based Scope 2 sits around 12 million tonnes CO2e, while market-based is around 2.7 million tonnes.
For any company with growing electricity demand, that gap is a signal. Both methods need clear explanations and strong data behind them.
Common Mistakes When Buying Scope 2 Software
- Choosing on brand alone. A big name does not guarantee the best Scope 2 features for your needs.
- Ignoring certificate tracking. If you buy renewables, weak certificate handling will hurt you at audit time.
- Skipping the data audit. Software cannot fix missing bills or unreliable meter data.
- Forgetting future rules. Ask how the vendor will adapt if hourly matching or deliverability rules arrive.
- Underestimating onboarding. Setup takes effort. Plan for data cleaning and training.
- Not testing with your own data. Demo data always looks perfect.
Best Practices for Accurate Scope 2 Reporting
Software helps, but good habits matter just as much.
- Report both location-based and market-based figures every time
- Keep proof for every certificate, contract and supplier factor
- Retire certificates in the correct period and register
- Document your emission factor sources and update them regularly
- Flag estimated data and replace it with actuals when you can
- Track interval meter data now, even if you do not need it yet
- Review your numbers with finance and facilities before you publish
Trends Shaping Scope 2 Emissions Accounting Software
More granular energy data
The industry is moving from annual averages toward hourly detail. Tools that store and analyze interval data will have an edge.
AI assistants inside the platform
Persefoni has launched an analytics agent. Sweep offers Sweepy. Schneider Electric introduced Sera. Expect more vendors to add similar assistants for anomaly detection and data questions.
Tighter links with finance and audit
Emissions data is now treated more like financial data. That is why audit trails, approvals and integrations with reporting tools keep growing in importance.
Better connection to procurement
Teams want to test how a PPA or certificate purchase changes their results before they sign. Scenario tools help with that.
Conclusion
Choosing scope 2 emissions accounting software is really about choosing how much trust you want in your energy numbers.
Watershed and Persefoni suit large, reporting-heavy teams. IBM Envizi and Schneider Electric Resource Advisor shine when energy and utility data is the main challenge. Microsoft Sustainability Manager fits Microsoft-based organizations. Sweep and Plan A give mid-market teams strong platforms with guided support.
Whichever you pick, make sure it reports both methods, tracks certificates properly, keeps a clear audit trail and can handle more granular data.
The Scope 2 rules are still evolving. A flexible platform and good data habits will keep you ready, whatever the final guidance says.
Start with your own data. Book two or three demos, load a few real sites and let the results guide you.
Frequently Asked Questions
What is scope 2 emissions accounting software?
It is a tool that collects your purchased energy data, applies emission factors and calculates Scope 2 emissions. Most tools report both location-based and market-based results and keep an audit trail.
Do I need both location-based and market-based reporting?
The GHG Protocol expects dual reporting for companies that operate in markets where contractual instruments, such as certificates, are available. Most disclosure frameworks and customers also ask for it. Good software calculates both automatically.
Is hourly matching required under the GHG Protocol?
No, not at this time. Hourly matching and deliverability were proposed in a consultation draft and are not final requirements. The latest direction points to two market-based methods, with details and timing still undecided.
How much does scope 2 emissions accounting software cost?
Most platforms use quote-based pricing that depends on sites, modules and users. Third-party estimates suggest enterprise platforms can run from tens of thousands to a few hundred thousand dollars a year. Some vendors offer lower tiers for smaller firms.
Can small businesses use this software?
Yes. Smaller companies often start with lighter tiers, simple calculators or spreadsheets. They move to a full platform when sites, data and reporting needs grow.
Can the software track RECs and PPAs?
Many platforms can, but depth varies. Ask each vendor how they apply, allocate and retire certificates, and how they prevent double counting.
What data do I need to get started?
You need energy use by site and period, such as kWh from bills or meters. For market-based reporting, you also need certificates, contracts and supplier emission rates.
Does the software replace an auditor?
No. Software makes your data cleaner and easier to verify. You may still need external assurance, depending on the rules that apply to you.
How is Scope 2 different from Scope 1 and Scope 3?
Scope 1 covers direct emissions from sources you own or control. Scope 2 covers emissions from purchased energy. Scope 3 covers all other indirect emissions across your value chain.
Ready to go deeper? Explore more guides at Carbon Market Network.