Carbon Market Network



Every company on the planet produces greenhouse gas emissions. But here is the question most businesses get wrong: they only count the emissions they can see.
The gases coming out of their factory chimney. The fuel burned in their delivery trucks. The electricity bill at the end of the month. These are real, and they matter.
But for most companies, these visible emissions are only a fraction of the true picture.
That is where Scope 1, Scope 2, and Scope 3 emissions come in.
This framework, developed by the Greenhouse Gas Protocol, gives businesses a clear, structured way to map every single source of greenhouse gas emissions connected to their operations, from the raw materials they buy to the moment a customer throws their product in the bin.
Whether you are a sustainability manager building your first carbon inventory, a student learning about climate policy, or a business leader trying to understand what your net-zero commitment actually requires, this guide explains everything you need to know.
We cover what each scope means, how they differ, real-world examples, the full list of 15 Scope 3 categories, the latest regulatory developments as of April 2026, and practical steps to start reducing emissions across all three scopes.
Let us get into it.
What Is the GHG Protocol? (The Foundation of All Three Scopes)
Before we define the three scopes, it helps to understand where they come from.
The terminology of Scope 1, 2, and 3 was introduced in the Greenhouse Gas Protocol (GHG Protocol), which sets the standards for calculating GHG emissions around the world.
Virtually every corporate sustainability reporting program in the world is based on the GHG Protocol, making it crucial to understand the framework.
The GHG Protocol was jointly established by the World Resources Institute (WRI) and the World Business Council for Sustainable Development (WBCSD).
It published its original Corporate Accounting and Reporting Standard in 2001, and it remains the bedrock on which frameworks like CDP, IFRS S2, CSRD, and the Science Based Targets initiative (SBTi) all build.
The GHG Protocol is the global standard for calculating and reporting corporate emissions.
It underpins climate reporting across frameworks like CDP and the International Sustainability Standards Board (ISSB), and regulations such as the Corporate Sustainability Reporting Directive (CSRD) and California SB 253.
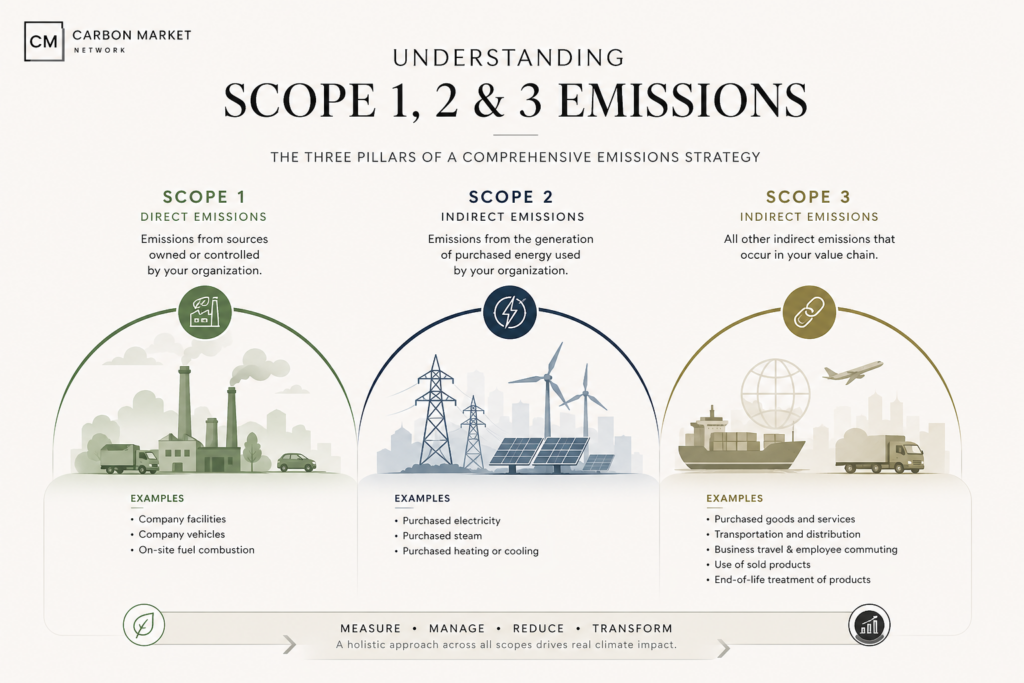
The three scopes divide a company’s emissions into categories based on where they come from and how much direct control the company has over them.
Think of it as moving from your own backyard outward, all the way to the rest of the world your business touches.
Carbon Market Insider Newsletter
Weekly insights on carbon markets, climate policy, carbon credits, and sustainability.
A Simple Way to Understand the Three Scopes
Imagine you run a coffee chain.
Scope 1 is the gas you burn in your roasting machines. You own the machine. You control the fuel. These are your direct emissions.
Scope 2 is the electricity you buy from the grid to power your cafes. You did not generate that electricity yourself, but you consumed it, and the power plant that made it released emissions on your behalf.
Scope 3 is everything else. The farmers who grew the coffee beans. The ships that transported them. The cups your customers throw away. The commutes your employees make every morning. Your suppliers’ suppliers. All of it.
This simple example captures the logic of the framework perfectly. Now let us go deeper.
What Are Scope 1 Emissions?
Definition
Scope 1 emissions are direct greenhouse gas emissions that occur from sources that are controlled or owned by an organization, such as emissions associated with fuel combustion in boilers, furnaces, and vehicles.
In plain terms: if your company owns it or operates it, and it releases greenhouse gases directly into the atmosphere, those are Scope 1 emissions.
The Four Sub-categories of Scope 1
1. Stationary Combustion
This covers the burning of fuels in fixed equipment like boilers, furnaces, turbines, heaters, incinerators, and generators at your facility.
Any fossil fuel burned on-site to generate heat, steam, or power falls into this category.
Example: A steel manufacturer burning natural gas in its blast furnaces produces Scope 1 stationary combustion emissions.
2. Mobile Combustion
Mobile combustion refers to all vehicles owned or controlled by a firm that burn fuel, such as cars, vans, and trucks.
The increasing use of electric vehicles means that some of an organisation’s fleet could fall into Scope 2 emissions.
Example: A logistics company’s fleet of diesel trucks. A construction firm’s bulldozers and excavators. An airline’s aircraft.
3. Fugitive Emissions
Fugitive emissions are leaks from greenhouse gases, such as those from refrigeration and air conditioning units. Refrigerant gases are a thousand times more dangerous than CO2 emissions.
This is a category that many companies underestimate. Hydrofluorocarbons (HFCs) used in refrigeration systems are incredibly potent greenhouse gases. Even small leaks have an outsized climate impact.
Example: A supermarket chain leaking refrigerant gases from its cold storage units. A hospital losing refrigerant from its air conditioning system.
4. Process Emissions
Some industries release greenhouse gases as a direct chemical byproduct of their industrial processes, not from burning fuel.
Example: A cement manufacturer releases CO2 when limestone is converted to lime during production. An aluminium smelter releases perfluorocarbons (PFCs) during the smelting process.
Real-World Scope 1 Examples
- An oil refinery burning fuel in on-site heaters and flaring gas
- A hotel running diesel backup generators
- A manufacturing plant using coal-fired boilers
- A farm emitting methane from livestock digestion
- A waste management company operating landfill sites that release methane
Who Has the Most Scope 1 Emissions?
Companies with the highest Scope 1 footprints are typically in heavy industry: oil and gas producers, cement manufacturers, steel makers, chemical plants, airlines, and shipping companies.
These businesses burn large volumes of fossil fuels as part of their core operations.
What Are Scope 2 Emissions?
Definition
Scope 2 emissions are indirect GHG emissions associated with the purchase of electricity, steam, heat, or cooling.
Although Scope 2 emissions physically occur at the facility where they are generated, they are accounted for in an organization’s GHG inventory because they are a result of the organization’s energy use.
You did not create these emissions yourself. But your decision to consume that energy is what caused them to exist.
That is why they are called “indirect” but still attributed to you.
How Scope 2 Emissions Are Calculated: Two Methods
The GHG Protocol recognizes two methods for calculating Scope 2 emissions, and understanding the difference between them matters a great deal.
The Location-Based Method
This method uses the average emissions intensity of the electricity grid in the region where you operate. It reflects the actual mix of power generation in your area: some coal, some gas, some renewables.
If your local grid is powered mostly by coal, your Scope 2 emissions will be high, even if you try to use energy efficiently.
If you operate in a country with a lot of hydropower or nuclear energy, your Scope 2 figure will naturally be lower.
The Market-Based Method
This method uses contractual instruments like Renewable Energy Certificates (RECs) or Power Purchase Agreements (PPAs) to reflect the actual source of electricity a company chooses to buy.
If your company has signed a PPA with a wind farm, you can report lower Scope 2 emissions using the market-based method, even if the physical grid still contains a mix of sources.
Both methods must be reported. Many companies show both figures to give a full and honest picture.
Real-World Scope 2 Examples
- A tech company running large data centres that consume enormous amounts of electricity
- A retail chain powering thousands of stores with grid electricity
- A manufacturer using purchased steam in its production process
- A hospital running heating and cooling systems from a district energy provider
- An office building purchasing electricity from the national grid
Why Tech Companies Have High Scope 2 Emissions
Data centres are one of the biggest Scope 2 stories of our time. A single hyperscale data centre can consume as much electricity as a small city. Google, Microsoft, Amazon Web Services, and Meta have all made significant investments in renewable energy specifically to reduce their Scope 2 footprints.
Microsoft, for example, reported in 2024 that its electricity consumption had grown substantially due to AI infrastructure expansion, making Scope 2 management increasingly critical to its climate commitments.
The 2025-2026 Scope 2 Reporting Updates
The GHG Protocol is undergoing its most significant update in a decade, and Scope 2 is one of the areas facing the largest transformation.
The GHG Protocol’s draft update proposes new requirements that will reshape how organisations buy electricity, use renewable energy certificates, and calculate market-based emissions.
The proposed updates mark a major shift in how Scope 2 emissions are reported.
The dual method remains, but the expectations for credible market-based reporting are rising.
The Scope 2 public consultation period opened in October 2025 and runs through January 2026.
The key proposed change is a shift from annual to more granular, hourly electricity matching, which would make it much harder for companies to claim green energy credentials through certificates that do not match actual consumption patterns in time and geography.
What Are Scope 3 Emissions?
Definition
Scope 3 covers indirect emissions in the value chain. For most companies, the value chain is responsible for the vast majority of emissions, often around 90%.
This makes it absolutely vital to include Scope 3 when calculating your carbon footprint.
Scope 3 is enormous, complex, and where most of the action actually is.
Scope 3 accounts for roughly 75% of the average company’s total emissions, and as much as 90% in sectors such as financial services, retail, and consumer goods, according to CDP’s 2024 Global Supply Chain Report.
Think about that for a moment. A company that only reports Scope 1 and Scope 2 emissions may be measuring as little as 10% of its true climate impact.
The other 90% sits invisibly in the supply chain, in customers’ hands, in employees’ daily commutes, and in the investments on its balance sheet.
Upstream vs. Downstream Scope 3
The GHG Protocol divides Scope 3 into two halves:
Upstream emissions are those that occur before products reach your company. They come from your suppliers, the production of goods and services you purchase, and activities like employee commuting and business travel.
Downstream emissions are those that occur after your product or service leaves your company. They include the distribution of your goods, the energy customers use when operating your products, and what happens when your products reach end-of-life.
The 15 Categories of Scope 3 Emissions (Explained Clearly)
The 15 categories in Scope 3 are intended to provide companies with a systematic framework to measure, manage, and reduce emissions across a corporate value chain.
The categories are designed to be mutually exclusive to avoid a company double-counting emissions among categories.
Upstream Categories (1 to 8)
Category 1: Purchased Goods and Services
These are emissions related to the production of any products purchased or services acquired by your company in the reporting year.
This is usually the single largest Scope 3 category for most businesses. It covers the carbon embedded in every raw material, component, and service you buy.
Example: Apple buys aluminium to manufacture iPhones. The mining, refining, and smelting of that aluminium releases CO2.
Apple has taken steps to address these emissions by transitioning to 100% recycled aluminium in certain products, significantly reducing the environmental impact associated with primary aluminium production.
Category 2: Capital Goods
These are emissions related to the production of capital goods purchased or acquired by your company in the reporting year. Capital goods include equipment, machinery, buildings, facilities, and vehicles.
Example: A logistics company buying a fleet of electric delivery vans. The manufacturing of those vehicles carries embedded emissions.
Category 3: Fuel and Energy-Related Activities
These are emissions related to the production of fuels and energy purchased and consumed that are not accounted for in your Scope 1 and Scope 2 emissions calculations.
This includes emissions from extracting and transporting fuels before they reach you, and transmission and distribution losses in electricity networks.
Category 4: Upstream Transportation and Distribution
These are emissions related to the transportation of purchased goods from your suppliers to your company in vehicles not owned or operated by your company.
Example: A fashion retailer shipping clothing from factories in Southeast Asia to its distribution centres in Europe. The cargo ships and freight planes used belong to third parties, so those emissions fall into Category 4.
Category 5: Waste Generated in Operations
These are emissions related to third-party disposal and treatment of both solid waste and wastewater from your company’s owned or controlled operations.
Example: A pharmaceutical manufacturer sending chemical waste to a third-party treatment facility. The treatment process releases emissions.
Category 6: Business Travel
These are emissions related to transportation of employees for business-related activities, accounting for vehicles owned or operated by third parties such as passenger cars, aircraft, trains, and buses.
Example: A consulting firm whose partners fly internationally for client meetings. Those flight emissions belong to the airline, not the consulting firm, but they are driven by the firm’s business activities.
Category 7: Employee Commuting
These are emissions related to the transportation of employees from their homes and their workplace. Emissions from remote work can be included in this category as well.
Example: A financial services firm with 5,000 employees who drive to work daily. The fuel those employees burn in their personal cars generates Scope 3 Category 7 emissions for the employer.
Category 8: Upstream Leased Assets
These are emissions related to the operation of leased assets, such as buildings, that are not included in your Scope 1 and Scope 2 emissions calculations.
Example: A company that leases office space in a building where the landlord controls energy procurement. If that energy consumption is not already in Scope 1 or 2, it goes here.
Downstream Categories (9 to 15)
Category 9: Downstream Transportation and Distribution
These are emissions related to transportation and distribution of sold products by vehicles and facilities not owned or controlled by your company.
Example: A consumer electronics brand using third-party couriers to deliver products to customers. The emissions from those delivery vans are Category 9.
Category 10: Processing of Sold Products
These are emissions related to processing of sold intermediate products by third parties. Intermediate products are products that require further processing, transformation, or inclusion in another product before use.
Example: A steel producer selling steel coils to an automaker. The automaker’s stamping and welding processes release Category 10 emissions for the steel producer.
Category 11: Use of Sold Products
This is often the biggest downstream category and one of the most important in total.
For example, a computer manufacturer might have relatively low Scope 1 and 2 emissions from its assembly facilities, but enormous Scope 3 emissions from the energy used by consumers to power its products over their lifetimes.
Example: A car manufacturer selling petrol-powered vehicles. Every litre of fuel a customer burns over the car’s lifetime creates Category 11 emissions for the manufacturer. This is why automakers’ Scope 3 emissions are typically far larger than all other scopes combined.
Category 12: End-of-Life Treatment of Sold Products
These are emissions related to the end-of-life treatment and waste management of sold products by consumers.
To address these emissions, Unilever is reducing packaging use, increasing the use of post-consumer recycled materials, and designing packaging for recyclability. The company also advocates for improved waste collection systems and scales up refill and reuse models.
Example: A food company whose plastic packaging ends up in landfill. The decomposition of that waste releases methane, which becomes a Category 12 emission for the food company.
Category 13: Downstream Leased Assets
These are emissions from the operation of assets owned by your company but leased to other parties.
For example, downstream leased assets accounted for 69% of the total Scope 3 emissions in 2023 for Prologis, a global leader in logistics real estate.
These emissions primarily stem from energy use in lighting, heating, and cooling operations of warehouses and distribution centres leased to third-party tenants.
Category 14: Franchises
These are emissions from the operation of franchises not included in Scope 1 or 2.
Example: A fast-food franchisor like McDonald’s. The emissions from franchisee-operated restaurants fall into Category 14 for the parent company.
This makes franchise-heavy businesses significantly more complex to report on.
Category 15: Investments
Category 15 emissions are also called financed emissions and cover emissions associated with investments. This category is mainly for financial institutions, but it is relevant for all other organisations with investments.
Example: A pension fund that invests in oil companies. The emissions from those companies are proportionally attributed to the pension fund as Category 15 emissions. This is why banks, asset managers, and insurance companies are increasingly under pressure to disclose and reduce their financed emissions.
Scope 1 vs. Scope 2 vs. Scope 3: Key Differences at a Glance
Understanding how the three scopes differ is just as important as understanding what they include. Here is a clear comparison.
| Scope 1 | Scope 2 | Scope 3 | |
|---|---|---|---|
| Type | Direct | Indirect (energy) | Indirect (value chain) |
| Source | Owned/controlled assets | Purchased energy | Supply chain activities |
| Control | High | Medium | Low |
| Typical share | 5-15% | 5-20% | 70-95% |
| Reporting status | Mandatory (most frameworks) | Mandatory | Increasingly mandatory |
| Hardest to reduce? | No | No | Yes |
| Where it occurs | On your premises | At the power plant | Everywhere else |
The key insight in this table is control. You have full control over Scope 1 because you operate the source. You have partial control over Scope 2 because you choose your energy supplier.
You have limited direct control over Scope 3 because it depends on decisions made by your suppliers, customers, and other third parties.
This is what makes Scope 3 both the most important and the most challenging scope to tackle.
Why Does This Framework Matter?
You Cannot Manage What You Do Not Measure
The core purpose of the three-scope framework is simple: it forces companies to look at the full picture of their climate impact, not just the parts that are easy to measure.
A company that only tracks Scope 1 and Scope 2 emissions might congratulate itself on switching to renewable electricity while continuing to source components from carbon-intensive suppliers.
Without Scope 3, that blind spot stays invisible.
The Science Requires It
The Paris Agreement’s goal of limiting global warming to 1.5°C requires deep cuts across the entire economy, not just in a few visible operations.
Science-based climate targets demand that companies address all three scopes to make a meaningful contribution.
The Science Based Targets initiative’s Corporate Net-Zero Standard requires companies to set both near-term and long-term targets covering Scope 1, 2, and relevant Scope 3 emissions, where Scope 3 is considered relevant if it represents at least 40% of the company’s total footprint.
More than 5,000 companies have now had targets validated by SBTi.
Regulations Are Catching Up Fast
The regulatory landscape for emissions disclosure has shifted dramatically. In 2026, reporting all three scopes is becoming a legal requirement for many companies globally.
European Union (CSRD)
The EU’s Corporate Sustainability Reporting Directive, operationalised through the European Sustainability Reporting Standards, requires full Scope 1, 2, and 3 disclosure under ESRS E1. Following the EU’s 2025 Omnibus I simplification package, the directive now applies to approximately 50,000 in-scope companies, including non-EU parent groups with significant EU turnover.
IFRS S2 (Global Standard)
IFRS S2 Climate-related Disclosures, issued by the ISSB in 2023, requires disclosure of Scope 1, 2, and Scope 3 emissions.
By the end of 2025, 21 jurisdictions, including the UK, Canada, Brazil, Japan, Singapore, Malaysia, and Australia, had adopted or committed to adopt ISSB standards, making IFRS S2 the closest thing to a global baseline for climate disclosure.
California, USA
California’s legislation, SB 253 and SB 261, will require large companies doing business in the state to report Scope 1 and 2 emissions by 2026, and Scope 3 by 2027.
These laws are likely to shape national standards over time, particularly for companies with multi-state operations.
CDP
CDP, through which over 23,000 organisations disclosed environmental data in 2025, has aligned its Climate Change questionnaire with IFRS S2 and ESRS E1.
Real-World Industry Examples: How the Three Scopes Look in Practice
Understanding the framework in the abstract is one thing. Seeing how it applies to specific industries makes it stick.
Example 1: An Airline
Scope 1: Jet fuel burned in aircraft engines. Aviation fuel combustion directly releases CO2, NOx, water vapour, and other gases at altitude. This is typically the dominant scope for airlines.
Scope 2: Electricity used in airport terminals, headquarters buildings, and maintenance hangars.
Scope 3: Manufacture of the aircraft. Fuel production (extraction and refining of aviation fuel). Passenger ground transport to and from the airport. The full lifecycle of cabin materials and catering packaging. Employee commuting.
Example 2: A Clothing Retailer
Scope 1: Small. Maybe a few delivery vehicles and a diesel generator for backup power.
Scope 2: Electricity used in stores, warehouses, and head offices.
Scope 3: Enormous. Cotton farming. Yarn spinning. Fabric weaving. Dyeing and finishing (often highly water and energy intensive). Garment assembly. Shipping. Packaging production. Customer washing and drying of clothes over their lifetime. End-of-life disposal of garments in landfill.
For most fast-fashion companies, Scope 3 represents over 95% of their total carbon footprint. This is why the fashion industry faces such intense scrutiny on supply chain sustainability.
Example 3: A Bank
Scope 1: Near-zero. A few company cars and backup generators.
Scope 2: Electricity for offices, data centres, and ATMs.
Scope 3: Overwhelmingly dominant, specifically Category 15 (financed emissions). The loans and investments a bank makes to fossil fuel companies, heavy industry, real estate developers, and other carbon-intensive sectors dwarf everything else. For major global banks, financed emissions can be 100 to 700 times larger than their operational emissions.
This is why organisations like the Partnership for Carbon Accounting Financials (PCAF) were created specifically to standardise how banks and investors measure and report financed emissions.
Example 4: A Food and Beverage Company
Scope 1: Manufacturing processes, on-site boilers, refrigeration at production facilities.
Scope 2: Electricity for factories and distribution centres.
Scope 3: Agricultural production of ingredients (often including methane from livestock, nitrous oxide from fertilisers, and land-use change), packaging production, cold chain transportation, retail refrigeration, consumer cooking, and food waste.
In 2021, Nestlé reported that 95.8% of its footprint was Scope 3. This is a pattern common across the food industry, where the vast majority of emissions sit outside company walls.
How to Calculate Scope 1, 2, and 3 Emissions
Step-by-Step: Building Your GHG Inventory
Step 1: Define Your Organizational Boundary
Before you measure anything, you need to decide which entities are “in” your carbon inventory. The GHG Protocol offers three approaches: equity share, financial control, and operational control.
Most companies use operational control, which means you include all operations over which you have authority to introduce and implement operating policies.
Step 2: Collect Activity Data
Gather data on every relevant activity. For Scope 1, this means fuel consumption records. For Scope 2, it means electricity and heat bills. For Scope 3, it means spend data, logistics records, supplier data, and product use estimates.
Step 3: Apply Emission Factors
Multiply your activity data by an emission factor, which is a figure that tells you how many kg of CO2-equivalent a unit of activity produces.
Emission factors are published by bodies like the US EPA, the UK Government (BEIS/DESNZ), the IEA, and IPCC. They vary by fuel type, country, and grid composition.
Step 4: Convert to CO2 Equivalent (CO2e)
To calculate a company’s greenhouse gas emissions, you need a method that accounts for the different types of gases released, not just carbon emissions. That is why emissions are typically expressed in carbon dioxide equivalent (CO2e), a unit that allows various greenhouse gases to be compared on a like-for-like basis. Some gases trap far more heat in the atmosphere than others, so CO2e provides a standardized way to measure and report a company’s full emissions footprint.
The six main greenhouse gases measured are CO2, methane (CH4), nitrous oxide (N2O), hydrofluorocarbons (HFCs), perfluorocarbons (PFCs), and sulphur hexafluoride (SF6).
Step 5: Calculate Your Total Footprint by Scope
Sum your emissions by category and scope. Report them separately so that audiences can see the breakdown clearly.
Step 6: Set a Base Year and Track Over Time
Choose a base year (usually the first year you can measure reliably) and track your emissions against it. This allows you to measure absolute reductions, not just improvements in intensity.
Calculation Methods for Scope 3
Because Scope 3 involves so many different activities, the GHG Protocol recognizes multiple calculation methods of varying quality:
Spend-Based Method: Multiply financial spend with a supplier by an emission factor for that category of goods or services. Easy to apply but less accurate, because it assumes emissions scale with cost.
Average Data Method: Use industry-average emission intensities per unit of output (per tonne of steel, per kilogram of beef, per litre of milk).
Supplier-Specific Method: Use actual emission data reported by your specific suppliers. This is the most accurate method and the one regulators increasingly prefer.
Hybrid Method: Combine supplier-specific data where available with industry averages for the rest.
The proposed GHG Protocol revision changes how supplier allocation works. For diversified suppliers, where GHG intensity varies meaningfully between business units, facilities, or product types, corporate-level allocation is no longer permitted. Companies must go further down the data hierarchy, toward product-level cradle-to-gate emissions data.
How Companies Are Reducing Emissions Across All Three Scopes
Reducing Scope 1
- Switching from fossil fuels to electrification (electric boilers, electric vehicle fleets)
- Installing on-site renewable energy like solar panels
- Improving energy efficiency in manufacturing processes
- Implementing leak detection and prevention programmes for refrigerant gases
- Switching to lower-carbon fuels like biomethane, hydrogen, or sustainable aviation fuel (SAF) where full electrification is not yet possible
Reducing Scope 2
- Signing Power Purchase Agreements (PPAs) with renewable energy developers
- Installing on-site solar, wind, or geothermal generation
- Purchasing high-quality Renewable Energy Certificates (RECs) matched by time and location
- Improving the energy efficiency of buildings, data centres, and production facilities
- Shifting high-energy operations to times when the electricity grid is cleanest
Reducing Scope 3
Scope 3 reduction requires more systemic action because you cannot directly control these emissions yourself.
On the supply chain side:
- Working with suppliers to measure and reduce their own emissions
- Setting supplier sustainability requirements and codes of conduct
- Sourcing from lower-carbon alternatives
- Redesigning products to use fewer high-carbon materials
- Reducing packaging and switching to recycled or bio-based materials
On the product use side:
- Designing products that use less energy during their operational life
- Transitioning product lines from fossil-fuel-powered to electric
- Extending product lifetimes through repairability and durability
On the employee and travel side:
- Introducing hybrid and remote working policies
- Subsidising public transport and cycling for employees
- Replacing short-haul flights with video conferencing
- Electrifying the company car fleet
On the investment and financing side:
- Banks and investors setting portfolio decarbonisation targets
- Engaging with portfolio companies on their own net-zero commitments
- Redirecting capital away from high-carbon assets
The Latest Developments in 2026: What Is Changing
GHG Protocol Is Undergoing Its Biggest Revision Since 2011
On 31 March 2026, the GHG Protocol published its Phase 1 Progress Update, the first tangible output of a revision process led by a 65-member Technical Working Group spanning 20+ countries and 42 meetings since September 2024.
The original Scope 3 standard has not been updated since 2011. A full public consultation draft is expected mid-2026, with a final revised standard targeted for late 2027.
The proposed revision introduces a hard minimum: at least 95% of required Scope 3 emissions must be covered. Up to 5% of required emissions may be excluded, but exclusions must be quantified, disclosed, and justified, not described qualitatively.
SBTi Is Tightening Net-Zero Rules
SBTi is currently developing Version 2 of its Corporate Net Zero Standard. The first draft was released in April 2025, followed by a revised draft in November 2025.
Final guidance is expected in 2026, with new standards approved and taking effect in 2027 or later.
Version 2 of the standard tightens the rules around residual emissions, beyond value chain mitigation, and sector-specific pathways.
There are now over 5,000 companies with targets validated by SBTi.
Mandatory Reporting Is Expanding Globally
In 2026, the regulatory environment has fundamentally shifted. Disclosing all three scopes is no longer just a voluntary best practice for sustainability leaders. It is becoming a legal obligation across the world’s largest economies.
In 2026, disclosing all three scopes is no longer optional for most large companies: the EU’s CSRD, the SBTi Net-Zero Standard, IFRS S2, CDP, and California’s SB 253 all now require it.
Companies that have not yet started measuring their Scope 3 emissions are already behind, and the gap will only grow wider as these frameworks come into full force.
Common Misconceptions About Scope 1, 2, and 3 Emissions
“Scope 3 is too complicated to measure.”
It is complex, but not impossible. Many software platforms now automate large parts of Scope 3 measurement using spend data, supplier questionnaires, and industry benchmarks. The GHG Protocol’s calculation guidance provides a detailed methodology for all 15 categories.
“We only need to worry about Scope 3 if it is material.”
Regulators are increasingly closing this loophole. Under the revised GHG Protocol, exclusions must be quantified and justified. Under CSRD, full disclosure is required. The bar for what counts as “immaterial” is rising.
“Buying renewable energy certificates eliminates our Scope 2 emissions.”
Many organisations currently rely on unbundled certificates to reduce their Scope 2 emissions. But the proposed GHG Protocol updates raise the bar, and the expectations for credible market-based reporting are rising. RECs that are not matched to the same time and location as actual energy consumption are increasingly viewed as insufficient.
“Scope 1 and 2 reductions are enough to meet our net-zero targets.”
For almost every company on earth, the answer is no. Since Scope 3 represents the majority of most companies’ footprints, net-zero is not achievable without it.
“Scope 3 is someone else’s responsibility.”
This is perhaps the most dangerous misconception. Your suppliers’ emissions are your business, because regulators, investors, and customers are increasingly holding you accountable for them.
Practical Takeaways: Where to Start
Starting to measure and reduce emissions across all three scopes can feel overwhelming. Here is a practical prioritisation.
If you are just beginning:
- Start with Scope 1 and Scope 2. These are mandatory to report under most frameworks and are easier to measure.
- Conduct a Scope 3 screening. Use the GHG Protocol’s free screening tools to identify which of the 15 categories are likely most significant for your business.
- Focus first on the two or three Scope 3 categories that represent the bulk of your footprint. For most companies, this will be Category 1 (purchased goods), Category 11 (use of sold products), or Category 15 (investments).
If you are at an intermediate stage:
- Move from spend-based to supplier-specific data for your highest-emission categories.
- Set reduction targets aligned with a recognised framework like SBTi.
- Build supplier engagement programmes to drive upstream reductions.
- Invest in product design changes that reduce Category 11 emissions.
If you are at an advanced stage:
- Work toward full value-chain transparency with granular, activity-level data.
- Align with the revised GHG Protocol standards as they finalise.
- Publish detailed, third-party assured disclosures under CSRD, IFRS S2, or equivalent frameworks.
- Integrate Scope 3 data into procurement decisions, capital allocation, and product development.
Conclusion
Scope 1, Scope 2, and Scope 3 emissions are not just accounting categories.
They are a lens through which businesses can see their full impact on the climate, and more importantly, find the most powerful places to reduce it.
Scope 1 gives you your direct house in order. Scope 2 asks how you power your operations. Scope 3 forces you to look at the whole system you are embedded in: where your raw materials come from, how your products are used, and what happens to them when they are no longer needed.
The good news is that the tools, frameworks, and regulatory guidance to measure and act on all three scopes have never been more accessible.
The regulatory momentum in 2026 is unmistakable. Companies that move early on Scope 3 measurement and reduction will be better positioned for compliance, more credible with investors, more attractive to sustainability-conscious customers, and more resilient to the physical risks of a changing climate.
The companies leading on climate in the decade ahead are not just measuring what they control.
They are taking responsibility for their entire footprint, and using it as a strategic advantage.
FAQ: Scope 1, Scope 2, and Scope 3 Emissions
Q: What is the simplest way to explain Scope 1, 2, and 3 emissions?
Scope 1 is what you burn. Scope 2 is what you buy. Scope 3 is everything else in your value chain, from the suppliers who make your inputs to the customers who use your products.
Q: Are Scope 3 emissions mandatory to report?
It depends on your location and size. Under the EU’s CSRD, full Scope 3 disclosure is mandatory for approximately 50,000 companies. California’s SB 253 requires Scope 3 disclosure from 2027 for large companies. IFRS S2 (adopted by 21+ jurisdictions) requires Scope 3. Even where it is not yet legally mandatory, frameworks like CDP and SBTi effectively require it for credible climate commitments.
Q: What percentage of emissions are Scope 3 on average?
For most companies, Scope 3 emissions represent the largest share of their carbon footprint, typically accounting for 75-95% of total emissions. In some sectors like financial services and consumer goods, this figure can reach 90% or above.
Q: What is the difference between Scope 2 location-based and market-based emissions?
The location-based method uses the average emissions intensity of your regional electricity grid. The market-based method uses the source of electricity you have contractually purchased, such as through a renewable energy certificate or a power purchase agreement. Both must be reported.
Q: Can a company have zero Scope 1 emissions
Theoretically yes, though it is rare. A fully remote software company with no company vehicles and no physical operations might come close. Most organisations have at least some Scope 1 emissions, even if small, from backup generators, refrigerants, or company cars.
Q: What are financed emissions?
Financed emissions are Scope 3 Category 15 emissions from a company’s investments and loans. They are particularly relevant for banks, pension funds, and asset managers. They represent the proportional share of greenhouse gas emissions of the companies and projects a financial institution funds.
Q: What is the GHG Protocol and why does it matter?
The GHG Protocol is the world’s most widely used standard for corporate greenhouse gas accounting. It defines the three-scope framework and provides the methodologies companies use to calculate their emissions. It underpins virtually every major reporting framework globally, including CSRD, IFRS S2, CDP, and SBTi.
Q: How often should companies report their emissions?
Most frameworks require annual reporting. Companies typically report the previous calendar or fiscal year’s emissions. The GHG Protocol recommends choosing a consistent base year and tracking progress against it over time.
Q: What is the difference between carbon footprint and GHG emissions?
A carbon footprint refers specifically to CO2 emissions, while GHG emissions cover all greenhouse gases including methane, nitrous oxide, and fluorinated gases. In practice, both terms are often used interchangeably because GHG emissions are typically expressed as CO2-equivalent (CO2e), which converts all gases into a comparable unit based on their global warming potential.
Q: What tools can companies use to measure Scope 3 emissions?
Many software platforms now exist to help companies calculate and track emissions across all three scopes, including tools from providers like Watershed, Persefoni, Sweep, and Normative, among others. The GHG Protocol also provides free Excel-based calculation tools, and many sustainability consultancies offer hands-on support for building a first inventory.