Carbon Market Network


The World’s First Legally Binding Climate Deal – And Why It Still Matters
In 1997, world leaders did something the world had never seen before.
They gathered in Kyoto, Japan, and agreed – in writing, with legal force – that industrialized countries must cut their greenhouse gas emissions.
Not “try to.” Not “consider.” Must.
That agreement became the Kyoto Protocol, the first international treaty to impose legally binding emission reduction targets on the countries most responsible for climate change.
It was imperfect. It was contentious. It was incomplete.
But it changed the way the world thinks about climate responsibility forever.
Even today, in 2026, every carbon market you read about, every climate treaty you hear discussed, every emission reduction target a country sets – traces its roots back to the Kyoto Protocol.
This guide gives you the full picture: what it is, how it worked, what it achieved, where it fell short, and what it left behind for the world.
Carbon Market Insider Newsletter
Weekly insights on carbon markets, climate policy, carbon credits, and sustainability.
What Is the Kyoto Protocol?
The Kyoto Protocol is an international environmental treaty that extended the 1992 United Nations Framework Convention on Climate Change (UNFCCC).
It committed industrialized nations to legally binding targets to reduce or limit their greenhouse gas (GHG) emissions.
It was adopted on December 11, 1997, at the Third Conference of Parties (COP3) to the UNFCCC, held in Kyoto, Japan.
Due to a complex multilateral ratification process, it did not enter into force until February 16, 2005.
At its peak, the Kyoto Protocol had 192 Parties, making it one of the most widely ratified environmental treaties in history.
The protocol operated under one foundational principle: industrialized countries had caused the majority of the greenhouse gas buildup in the atmosphere through two centuries of industrial activity.
They had the economic capacity to act. So they should act first, and they should act in a legally enforceable way.
This principle is known as “common but differentiated responsibilities and respective capabilities” (CBDR-RC) – all nations share a responsibility for the climate, but those with greater historical contribution and economic capacity carry a heavier burden.
Here is a snapshot of the Kyoto Protocol at a glance:
| Detail | Information |
|---|---|
| Full Name | Kyoto Protocol to the UNFCCC |
| Adopted | December 11, 1997 |
| Entered into Force | February 16, 2005 |
| Location of Adoption | Kyoto, Japan (COP3) |
| Parent Treaty | UNFCCC (1992) |
| Total Parties at Peak | 192 |
| First Commitment Period | 2008 – 2012 |
| Second Commitment Period | 2013 – 2020 (Doha Amendment) |
| GHG Reduction Target (CP1) | Average 5.2% below 1990 levels |
| GHG Reduction Target (CP2) | At least 18% below 1990 levels |
| Countries with Binding Targets | Annex I (industrialized) countries |
| Succeeded by | Paris Agreement (2015) |
Why Was the Kyoto Protocol Created? The Road to 1997
To truly understand the Kyoto Protocol, you need to understand the world that created it.
The Science Gets Loud
By the late 1980s, climate science had reached a level of consensus the world could no longer ignore.
The Intergovernmental Panel on Climate Change (IPCC) was established in 1988 to assess scientific information on climate change. Its early reports were unambiguous: human-caused greenhouse gas emissions were warming the planet, and the consequences would be severe.
Governments could not pretend they didn’t know.
The Earth Summit of 1992
In June 1992, world leaders gathered in Rio de Janeiro, Brazil, for the Earth Summit – formally the United Nations Conference on Environment and Development (UNCED).
The summit produced the UNFCCC, which entered into force in March 1994.
The UNFCCC was a landmark achievement. It acknowledged the threat of climate change and established a framework for international cooperation.
But it had a critical flaw: it set no binding emission reduction targets.
It asked countries to voluntarily stabilize GHG concentrations but imposed no legal obligations to do so.
Predictably, global emissions kept rising.
From Rio to Kyoto: Growing Pressure
The Conference of Parties to the UNFCCC met annually after 1994.
At COP1 in Berlin in 1995, parties adopted the Berlin Mandate, which called for the negotiation of binding emission reduction commitments for developed countries in a new legal instrument.
At COP2 in Geneva in 1996, the Geneva Declaration called for legally binding targets based on the IPCC’s science.
By COP3 in Kyoto in 1997, the political pressure had reached a peak.
After two weeks of intense negotiations, the Kyoto Protocol was born.
The Key Milestone Timeline
| Year | Event |
|---|---|
| 1988 | IPCC established to assess climate science |
| 1990 | IPCC First Assessment Report confirms human-caused warming |
| 1992 | Earth Summit in Rio; UNFCCC adopted |
| 1994 | UNFCCC enters into force |
| 1995 | COP1 in Berlin; Berlin Mandate calls for binding targets |
| 1996 | COP2 in Geneva; Geneva Declaration supports legally binding commitments |
| 1997 | COP3 in Kyoto; Kyoto Protocol adopted (December 11) |
| 1998 | U.S. signs but does not ratify; others begin signing |
| 2001 | U.S. withdraws under Bush administration |
| 2004 | Russia ratifies, triggering the 55% threshold |
| 2005 | Kyoto Protocol enters into force (February 16) |
| 2008 | First commitment period begins |
| 2012 | First commitment period ends; Canada withdraws; Doha Amendment adopted |
| 2013 | Second commitment period begins |
| 2015 | Paris Agreement adopted at COP21 |
| 2020 | Second commitment period ends; Doha Amendment enters into force |
| 2023 | Second commitment period formally closed at COP28 in Dubai |
The Structure of the Kyoto Protocol: How It Actually Worked
The Kyoto Protocol was not just a list of pledges. It was a carefully designed legal instrument with targets, mechanisms, reporting requirements, and enforcement tools.
Here is how it functioned end to end.
Annex Structure
The Kyoto Protocol inherited the UNFCCC’s “annex-based” structure, which divided countries into groups based on their development status and historical emissions.
Annex I Parties were industrialized countries and economies in transition (EITs). They had binding emission reduction targets.
Non-Annex I Parties were developing countries. They had no binding reduction targets but took on general commitments to report on emissions and pursue sustainable development.
Annex II Parties (a subset of Annex I) were OECD countries with a specific obligation to provide financial and technological support to developing countries.
Setting Targets: The Annex B List
Specific emission targets for Annex I countries were listed in Annex B of the Kyoto Protocol.
Targets were expressed as a percentage of each country’s emissions in the 1990 base year (though some countries used different base years for certain gases).
Countries were assigned a total Assigned Amount – the maximum total emissions allowed over the commitment period, measured in tonnes of CO₂ equivalent.
The Compliance Mechanism
The Kyoto Protocol had one of the most sophisticated compliance systems ever built into an international environmental treaty.
A Compliance Committee composed of two branches – a Facilitative Branch and an Enforcement Branch – oversaw adherence to commitments.
The Facilitative Branch offered advice, support, and early warning to countries at risk of non-compliance.
The Enforcement Branch made binding determinations on whether a party had met its commitments.
If a country exceeded its assigned amount:
- It had to make up the shortfall in the next commitment period.
- A 30% penalty was added on top of the shortfall (so it had to cut an extra 30% of the excess in the next period).
- It was suspended from selling units in the emissions trading system.
This was genuinely consequential enforcement – far stronger than anything in the Paris Agreement.
Reporting and Verification
All Annex I parties had to submit annual national GHG inventory reports.
These reports were reviewed by Expert Review Teams (ERTs) – groups of international experts who assessed accuracy, completeness, and consistency.
Countries also submitted National Communications every four years, covering policies, measures, and projections.
This created a transparent, third-party-verified data ecosystem that set the gold standard for climate reporting.
The Six Greenhouse Gases Covered by the Kyoto Protocol
The Kyoto Protocol did not just cover carbon dioxide. It covered six major greenhouse gases that together accounted for the vast majority of human-caused climate forcing.
| Greenhouse Gas | Chemical Formula | Primary Sources | Global Warming Potential (100-year GWP vs CO₂) |
|---|---|---|---|
| Carbon Dioxide | CO₂ | Fossil fuel combustion, deforestation, cement production | 1 (baseline) |
| Methane | CH₄ | Agriculture, livestock, landfills, natural gas leaks | ~25 |
| Nitrous Oxide | N₂O | Agriculture, industrial processes, wastewater | ~298 |
| Hydrofluorocarbons | HFCs | Refrigerants, air conditioning, aerosols | 140 – 11,700 |
| Perfluorocarbons | PFCs | Aluminum smelting, semiconductor manufacturing | 6,500 – 9,200 |
| Sulfur Hexafluoride | SF₆ | Electrical transmission equipment, magnesium processing | ~23,900 |
All emissions from these six gases were converted into a single unit – CO₂ equivalent (CO₂e) – using their respective GWP values. This allowed for a single, unified accounting system across all gases and all countries.
Why does this matter?
Because CO₂ alone does not tell the full story of climate impact.
A relatively small release of SF₆ can have the same warming effect over 100 years as nearly 24,000 times that amount in CO₂. By covering all six gases, the Kyoto Protocol captured a much more complete picture of human-caused warming.
Annex I Country Targets Under the Kyoto Protocol
One of the most concrete and defining features of the Kyoto Protocol was the assignment of specific, quantified emission targets to each Annex I country.
Below are the key targets set under the First Commitment Period (2008–2012) as listed in Annex B of the Protocol.
First Commitment Period Targets (2008–2012)
| Country / Group | Kyoto Target (% of 1990 levels) | Required Change |
|---|---|---|
| European Union (15 member states) | 92% | -8% below 1990 |
| United States (signed, never ratified) | 93% | -7% below 1990 |
| Japan | 94% | -6% below 1990 |
| Canada (withdrew in 2012) | 94% | -6% below 1990 |
| Hungary | 94% | -6% below 1990 |
| Poland | 94% | -6% below 1990 |
| Switzerland | 92% | -8% below 1990 |
| Czech Republic | 92% | -8% below 1990 |
| Slovakia | 92% | -8% below 1990 |
| Russia | 100% | Stabilize at 1990 levels |
| Ukraine | 100% | Stabilize at 1990 levels |
| New Zealand | 100% | Stabilize at 1990 levels |
| Norway | 101% | +1% above 1990 |
| Australia | 108% | +8% above 1990 |
| Iceland | 110% | +10% above 1990 |
The variation in targets reflects different national circumstances.
Countries like Australia and Iceland, whose economies were heavily energy-intensive or still rapidly growing, were permitted small increases rather than cuts.
The fact that the EU agreed to the most ambitious target (-8%) as a bloc was significant.
The EU used an internal “burden-sharing agreement” to distribute its joint target among member states, with some countries cutting more and others cutting less.
Individual EU Member State Targets Under the Burden-Sharing Agreement
| EU Member State | Target (% change from 1990) |
|---|---|
| Luxembourg | -28% |
| Denmark | -21% |
| Germany | -21% |
| Austria | -13% |
| United Kingdom | -12.5% |
| Belgium | -7.5% |
| Italy | -6.5% |
| Netherlands | -6% |
| Finland | 0% (stabilize) |
| France | 0% (stabilize) |
| Sweden | +4% |
| Ireland | +13% |
| Spain | +15% |
| Greece | +25% |
| Portugal | +27% |
This internal differentiation within the EU shows just how flexible, and politically complex, burden-sharing agreements can be.
The Three Flexibility Mechanisms of the Kyoto Protocol
The Kyoto Protocol’s three market-based mechanisms were among its most groundbreaking innovations.
They created the modern global carbon market and introduced the concept of tradable emission units into international law.
The logic behind them: it is cheaper to reduce emissions in some places than others.
So let the market find the cheapest reductions – as long as the total global reduction is achieved.
Mechanism 1: International Emissions Trading (IET)
Legal basis: Article 17 of the Kyoto Protocol
How it worked:
Each Annex I country received a total Assigned Amount of greenhouse gas emissions it was allowed to produce over the commitment period, broken into Assigned Amount Units (AAUs).
Each AAU represented the allowance to emit one metric tonne of CO₂ equivalent.
Countries that reduced emissions below their assigned amount had surplus AAUs. Countries struggling to meet targets could purchase those surplus units.
This created an international cap-and-trade system between governments.
The carbon market also allowed for the trading of other unit types:
| Unit Type | Abbreviation | Source |
|---|---|---|
| Assigned Amount Units | AAUs | Allocated to Annex I countries based on targets |
| Removal Units | RMUs | Generated by land use, land-use change, and forestry (LULUCF) activities |
| Certified Emission Reductions | CERs | Generated by CDM projects in developing countries |
| Emission Reduction Units | ERUs | Generated by JI projects between Annex I countries |
All units were equivalent to one tonne of CO₂e and could be used interchangeably to meet Kyoto targets.
Real-world example:
Russia stabilized emissions at 1990 levels, but its economy contracted sharply in the 1990s after the Soviet Union’s collapse.
So Russia’s actual emissions were far below 1990 levels by the time the commitment period started.
This created a massive surplus of AAUs – dubbed “hot air” by critics – that Russia could sell to countries like Japan that needed extra credits.
Mechanism 2: The Clean Development Mechanism (CDM)
Legal basis: Article 12 of the Kyoto Protocol
Operational start: 2006
The CDM was the most ambitious and far-reaching of the three mechanisms. It was essentially a bridge between the developed and developing world on climate action.
How it worked:
An Annex I (developed) country, or a private company operating within it, could invest in an emission reduction or removal project in a non-Annex I (developing) country.
The project had to meet strict criteria:
- It had to result in real, measurable, verifiable emission reductions.
- It had to be additional – the reductions had to be above and beyond what would have happened without the project.
- It had to contribute to sustainable development in the host country.
If approved by the CDM Executive Board, the project generated Certified Emission Reductions (CERs).
Each CER equaled one tonne of CO₂ equivalent reduced.
The investing country used those CERs to offset a portion of its own Kyoto target.
Types of CDM projects:
| Project Type | Example Activities |
|---|---|
| Renewable Energy | Wind farms, solar plants, small hydro, geothermal |
| Energy Efficiency | Industrial boiler upgrades, efficient lighting, building retrofits |
| Fuel Switching | Replacing coal or oil with natural gas or biomass |
| Methane Capture | Landfill gas recovery, coal mine methane capture, livestock waste digesters |
| Forestry (REDD) | Afforestation and reforestation projects |
| Agriculture | Reduced tillage, rice paddy methane reduction |
| Industrial Gases | Destruction of HFCs and N₂O from industrial processes |
| Transport | Modal shift projects, fuel efficiency standards |
CDM Scale and Impact:
Between 2001 and 2012, the CDM generated over 1.5 billion tonnes of CO₂ equivalent in emission reductions.
By 2012, China hosted approximately 52% of all CDM projects, followed by other major developing economies.
The CDM channeled massive foreign investment into clean energy infrastructure in developing countries that might otherwise have relied on fossil fuels for decades longer.
It was also the direct predecessor of the voluntary carbon market as it exists today, and it shaped the architecture of Article 6 of the Paris Agreement.
Mechanism 3: Joint Implementation (JI)
Legal basis: Article 6 of the Kyoto Protocol
How it worked:
Similar in structure to the CDM, Joint Implementation allowed one Annex I country to fund emission reduction projects in another Annex I country – typically a wealthier country investing in a poorer transition economy.
In exchange, the investing country received Emission Reduction Units (ERUs).
ERUs were deducted from the host country’s assigned amount and added to the investing country’s balance, ensuring no double-counting.
Why was JI relevant?
Countries in Central and Eastern Europe – like Russia, Ukraine, Poland, and the Czech Republic – had older, less efficient industrial infrastructure.
Upgrading a Soviet-era power plant or factory in Eastern Europe was far cheaper per tonne of CO₂ reduced than building new renewable energy in Western Europe.
JI let Western European countries fund those cheap upgrades and count the resulting reductions toward their own targets.
JI Track 1 vs. Track 2:
| Feature | Track 1 | Track 2 |
|---|---|---|
| Used when | Host country meets all eligibility requirements | Host country does not meet all eligibility requirements |
| Verification | National determination by host country | International verification by Accredited Independent Entity (AIE) |
| Oversight | Minimal international oversight | Full supervision by JI Supervisory Committee |
| Speed | Faster, less bureaucratic | Slower, more rigorous |
Scale: During its operational life under the Kyoto Protocol, 597 JI projects were registered across Annex I countries.
The First Commitment Period (2008–2012): What Happened?
The first commitment period ran from January 1, 2008 to December 31, 2012.
37 industrialized countries and economies in transition participated, committing to reduce their combined GHG emissions by an average of 5.2% below 1990 levels.
Results of the First Commitment Period
| Party / Group | Target (vs. 1990) | Actual Domestic Reduction | Met Target? |
|---|---|---|---|
| EU-15 | -8% | -11.7% (domestic) | Yes – significantly exceeded |
| Switzerland | -8% | Exceeded with credits | Yes |
| Germany | -21% | -26% (approximately) | Yes – exceeded |
| United Kingdom | -12.5% | -22% (approximately) | Yes – exceeded |
| Russia | Stabilize at 1990 | Well below 1990 | Yes (due to economic contraction) |
| Japan | -6% | Met target using flexibility mechanisms | Yes (with CERs/ERUs) |
| Canada | -6% | +35% above 1990 | No – withdrew before period ended |
| United States | -7% (target) | Increased emissions significantly | Not applicable – never ratified |
Overall verdict for CP1:
The EU and most European countries overachieved their targets domestically.
Some countries like Japan and New Zealand, relied heavily on purchasing CERs and AAUs to meet their targets.
The system worked for those who participated. However, global emissions rose by approximately 29% between 1990 and 2010, as major non-Kyoto emitters continued on a high-growth trajectory.
The Doha Amendment and the Second Commitment Period (2013–2020)
What Was the Doha Amendment?
At COP18 in Doha, Qatar, on December 8, 2012, parties adopted the Doha Amendment to the Kyoto Protocol.
This established the second commitment period, running from January 1, 2013 to December 31, 2020.
The Doha Amendment also:
- Updated the list of greenhouse gases to include nitrogen trifluoride (NF₃)
- Revised several articles that specifically referenced the first commitment period
- Set a new collective reduction target of at least 18% below 1990 levels
The amendment required 144 instruments of acceptance to enter into force.
It finally crossed that threshold on October 28, 2020, entering into force on December 31, 2020, the very last day of the second commitment period.
Who Participated in the Second Commitment Period?
Notably, several major players declined to join CP2, significantly reducing its scope.
| Country/Group | CP1 Participation | CP2 Participation | Reason for Change |
|---|---|---|---|
| European Union | Yes | Yes | Committed to -20% target |
| Australia | Joined later | Yes | Ratified Kyoto in 2007 |
| Switzerland | Yes | Yes | Continued commitment |
| Norway | Yes | Yes | Continued commitment |
| Japan | Yes | No | Rejected new binding targets post-Fukushima energy concerns |
| Russia | Yes | No | Declined; did not accept Doha Amendment |
| Canada | Yes (withdrew 2012) | No | Formally withdrew from Protocol |
| New Zealand | Yes | No | Declined new commitments |
| United States | Never ratified | Never ratified | Continued non-participation |
| Belarus | Yes | Accepted but withdrew | Dropped out of CP2 |
| Kazakhstan | Yes | Accepted but withdrew | Dropped out of CP2 |
| Ukraine | Yes | Accepted but withdrew | Dropped out of CP2 |
The second commitment period ultimately covered only about 11% of global emissions in 2012, far less than ideal, but still a meaningful set of legally binding commitments.
Results of the Second Commitment Period
The results were stronger than many observers expected.
Participating countries as a whole exceeded their collective commitment significantly.
| Key Result | Data |
|---|---|
| Committed reduction (vs. 1990) | At least 18% |
| Average annual reduction achieved | 22% below 1990 levels |
| Overall reduction in 2020 vs. 1990 | Approximately 28% |
| EU GHG reduction by 2020 vs. 1990 | 31% – well above the 20% target |
| Participating Annex I parties | 34 (originally 37, minus Belarus, Kazakhstan, Ukraine) |
These results were confirmed by UNFCCC reporting in July 2024.
At COP28 in Dubai in late 2023, countries formally closed the second and final commitment period of the Kyoto Protocol.
The Kyoto Protocol’s Compliance System: How Non-Compliance Was Handled
One of the most important and most underappreciated aspects of the Kyoto Protocol was its compliance architecture.
This was not a soft framework. It had real teeth.
The Compliance Committee
The Kyoto Compliance Committee had two branches:
| Branch | Function | Membership |
|---|---|---|
| Facilitative Branch | Provides advice, support, and early warnings to parties that may struggle with compliance | 10 members |
| Enforcement Branch | Makes legally binding determinations on whether a party met its commitment | 10 members |
Both branches had representatives from each of the five UN regional groups plus representatives from SIDS (Small Island Developing States), Annex I, and Non-Annex I parties.
The Enforcement Process
If the Expert Review Team (ERT) found that a party’s emissions exceeded its Assigned Amount:
Step 1: The Enforcement Branch initiated a compliance proceeding.
Step 2: The party had the right to submit additional information and present its case.
Step 3: If the Enforcement Branch determined non-compliance, consequences were applied:
- The party’s Assigned Amount for the next commitment period was reduced by 1.3 times the amount of excess emissions (30% penalty on top of the shortfall).
- The party was required to submit a Compliance Action Plan outlining how it would achieve future compliance.
- The party was suspended from selling units under the IET mechanism.
This created real financial and reputational consequences for non-compliance – a standard that the Paris Agreement ultimately moved away from.
Successes of the Kyoto Protocol
The Kyoto Protocol’s record is better than its reputation.
1. Participating Countries Actually Met Their Targets
Countries that participated in the Kyoto Protocol’s commitment periods broadly met and exceeded their obligations.
The EU overachieved dramatically in both periods. Germany cut emissions by about 26% in the first period against a -21% target. The UK cut by roughly 22% against a -12.5% target.
In the second period, the overall group achieved a 28% reduction in 2020 compared to 1990, well above the required 18%.
2. It Proved the Concept of Legally Binding Climate Targets
Before Kyoto, there was genuine debate about whether countries would ever accept legally binding emission reductions.
Kyoto proved they would, and proved they could deliver on those targets.
This demolished the argument that binding commitments were economically or politically impossible.
3. It Built the Global Carbon Market
The CDM alone generated over 1.5 billion tonnes of CO₂e reductions between 2001 and 2012.
The EU ETS, launched in 2005 and directly inspired by Kyoto’s trading mechanisms, became the world’s largest carbon market. By 2010, 97% of international carbon market trade flowed through the EU ETS.
Carbon pricing – now a standard tool in climate policy globally – was pioneered at scale by the Kyoto Protocol.
4. It Created the MRV Infrastructure
The system of measuring, reporting, and verifying emissions that Kyoto built became the global standard.
Annual GHG inventories, expert review teams, national communications, and registries – all of this infrastructure was designed under Kyoto and remains the backbone of climate accountability today.
5. It Delivered Clean Technology to Developing Countries
CDM projects channeled tens of billions of dollars of clean energy investment to developing countries.
Wind, solar, hydro, biogas, energy efficiency – technologies that might have taken decades longer to arrive in many developing economies reached them through CDM financing.
6. It Catalyzed Renewable Energy Growth
Research confirms that the Kyoto Protocol significantly increased renewable energy consumption by approximately 18% and boosted renewable electricity generation by around 60% in participating countries, relative to the pre-Kyoto period.
That shift toward renewables, catalyzed by Kyoto, has had lasting effects on energy systems worldwide.
Failures and Criticisms of the Kyoto Protocol
For all its genuine achievements, the Kyoto Protocol carried deep structural flaws that limited its global impact.
1. It Excluded the World’s Largest Emitters
The most fundamental problem with the Kyoto Protocol was that developing countries – including the world’s largest and fastest-growing emitters – had no binding emission reduction targets.
| Country | Status Under Kyoto | Global Emissions Share (approx. 2012) |
|---|---|---|
| China | Non-Annex I – no binding target | ~25–28% |
| United States | Signed, never ratified | ~15–17% |
| European Union | Annex I – binding target | ~10–11% |
| India | Non-Annex I – no binding target | ~5–6% |
| Russia | Annex I – bound in CP1 only | ~5% |
| Japan | Annex I – bound in CP1 only | ~3–4% |
The countries with binding Kyoto targets represented only about 11% of global emissions by the second commitment period.
Even if every Kyoto party achieved perfect compliance, global emissions would continue rising simply because the biggest emitters were not bound.
And that is exactly what happened. Global CO₂ concentrations rose every single year throughout the Kyoto era.
2. The United States Never Ratified
The U.S. was, at the time of Kyoto’s adoption, the world’s largest single emitter of greenhouse gases.
Its non-participation was a body blow to the protocol’s credibility.
The Clinton administration signed in 1998 but never submitted the treaty for Senate ratification. The Bush administration rejected it outright in 2001.
Without the U.S., the protocol covered a fundamentally incomplete slice of the global problem.
3. Canada’s Withdrawal Was a Damaging Signal
Canada ratified the Kyoto Protocol in 2002. But by 2012, its emissions were approximately 35% above its Kyoto target.
Rather than face penalties, Canada became the first (and only) country to formally withdraw from the Kyoto Protocol in December 2012.
The withdrawal sent a damaging signal that a wealthy nation could simply walk away from legally binding climate commitments when they became inconvenient.
4. The “Hot Air” Problem
Russia’s economic collapse after the Soviet Union’s dissolution meant its actual emissions in the 1990s and 2000s were far below its 1990 baseline – not due to any deliberate climate action, but due to industrial contraction.
This created an enormous surplus of AAUs called “hot air” that Russia could legally sell to other countries.
Countries that purchased Russian hot air were essentially buying permission to emit more without any real emission reduction taking place anywhere.
This undermined the environmental integrity of the trading system.
5. CDM Criticism: Additionality and Double-Counting Issues
The CDM faced persistent criticism throughout its operation.
Additionality failures: Many CDM projects were accused of not being truly “additional” i.e. the emission reductions would have happened anyway, without the CDM’s involvement. Critics estimated that a significant portion of CDM credits did not represent genuine new reductions.
HFC-23 scandal: One of the most notorious CDM abuses involved industrial refrigerant plants in China and India that were paid enormous sums for destroying HFC-23 – a potent greenhouse gas. It emerged that some plants had actually ramped up production of the parent compound specifically to generate more HFC-23 for destruction, solely to earn CDM credits. This was a perverse incentive that the CDM’s design had not anticipated.
Double-counting risk: Since developing countries had no binding targets, there was no formal accounting mechanism to prevent both the host country and the investing country from claiming the same emission reduction.
6. The Second Commitment Period Was Far Too Narrow
When the Doha Amendment was negotiated in 2012, Japan, Russia, New Zealand, and Canada all declined to join the second commitment period.
This left CP2 covering only 11% of global emissions, a fraction of what was needed to drive meaningful global change.
7. The Protocol Did Not Stop Global Emissions Rising
Despite domestic successes within participating countries, global GHG concentrations kept rising throughout the Kyoto era.
This was the protocol’s most fundamental limitation: it was too narrow in scope to address a problem that required universal action.
Countries and Their Kyoto Stories: A Closer Look
The European Union
The EU was the Kyoto Protocol’s most consistent and ambitious champion.
It ratified early, exceeded its targets in both commitment periods, and used Kyoto as the launching pad for the EU Emissions Trading System (EU ETS) – the world’s first major carbon market.
The EU-15 achieved an 11.7% domestic reduction in the first commitment period against an 8% target.
By 2020, the EU’s GHG emissions were 31% below 1990 levels, nearly double its second-period target of 20%.
The EU’s success showed that economic growth and emission reductions can go hand in hand.
Germany
Germany was arguably the Kyoto Protocol’s highest-performing individual country.
It committed to a -21% reduction and vastly exceeded it, driven by:
- The energy efficiency upgrade of former East German industry after reunification
- A rapid expansion of wind energy
- The Energiewende (energy transition) policy
- Aggressive phase-out of coal-fired power in some regions
Germany’s performance helped the EU-15 as a whole meet its targets even as some other member states struggled.
Japan
Japan committed to a -6% reduction but found it genuinely difficult to meet domestically.
After the Fukushima nuclear disaster in 2011, Japan shut down most of its nuclear power plants. This forced increased reliance on fossil fuels and pushed emissions upward just as the first commitment period was closing.
Japan ultimately met its CP1 target by purchasing significant quantities of CERs and AAUs from other countries.
Japan declined to participate in the second commitment period, citing the need for a more universal agreement that included the U.S., China, and other major emitters.
Russia
Russia’s experience with the Kyoto Protocol was uniquely shaped by its post-Soviet economic history.
The collapse of Soviet industry in the 1990s meant Russia’s emissions fell dramatically – not by design, but by economic contraction.
Russia held enormous amounts of surplus AAUs (“hot air”) that it could sell.
Russia ratified the protocol in November 2004 – a strategically important moment, as Russia’s ratification pushed the cumulative emissions of ratifying parties above the 55% threshold required for the protocol to enter into force.
Russia did not join the second commitment period.
Canada
Canada ratified the Kyoto Protocol in 2002 with a target of -6% below 1990 levels.
But Canada’s emissions grew rapidly, driven largely by the expansion of oil sands extraction in Alberta.
By 2012, Canada’s emissions were approximately 35% above its Kyoto target.
Canada formally withdrew from the Kyoto Protocol in December 2012, becoming the only country to do so.
The Canadian government argued that without the participation of the U.S. and major developing countries, Canada would be placing itself at an economic disadvantage.
United States
The U.S. story with the Kyoto Protocol is perhaps the most consequential in the treaty’s history.
The Clinton administration’s Vice President Al Gore participated actively in the negotiations. The U.S. signed the protocol in November 1998.
But the U.S. Senate had already passed the Byrd-Hagel Resolution in 1997 – a 95-0 vote expressing that the Senate would not ratify any climate treaty that exempted major developing-country economies from binding commitments.
When the Bush administration took office in 2001, it formally rejected the Kyoto Protocol.
The Obama administration pursued climate action through executive action and eventually the Paris Agreement, but never revisited Kyoto.
The absence of the world’s largest economy (at the time) and second-largest emitter fundamentally limited what Kyoto could accomplish.
The Kyoto Protocol vs. The Paris Agreement: A Full Comparison
The Kyoto Protocol and the Paris Agreement represent two distinct generations of international climate governance.
Understanding the differences between them helps explain both the evolution of global climate policy and its remaining challenges.
| Feature | Kyoto Protocol | Paris Agreement |
|---|---|---|
| Year Adopted | 1997 | 2015 |
| Entered into Force | 2005 | 2016 |
| Parties | 192 | 195+ |
| Who Has Binding Targets | Annex I (industrialized countries) only | All parties (but see below) |
| Nature of Emission Targets | Legally binding specific percentages | Nationally Determined Contributions (NDCs) – self-set |
| Target-Setting Approach | Top-down (internationally negotiated per country) | Bottom-up (each country sets its own) |
| Legal Enforcement | Binding penalties for missing targets | No punitive enforcement for missing NDCs |
| Temperature Goal | No explicit global temp limit specified | Well below 2°C; pursuing 1.5°C |
| Flexibility Mechanisms | CDM, JI, IET | Article 6 carbon markets (under development) |
| Carbon Market | CDM, JI, IET fully operational | Article 6 rules being finalized; SDM replacing CDM |
| Developing Country Obligations | No binding emission targets | Expected to set and pursue NDCs; enhanced support |
| Finance Mechanism | CDM, Annex II obligations | Green Climate Fund, NCQG (under negotiation) |
| Transparency | Expert review teams, annual inventories | Enhanced Transparency Framework (ETF) |
| Review Mechanism | Compliance Committee (binding) | Global Stocktake every 5 years |
| Major Absentees | U.S. (never ratified); Russia, Japan, Canada (CP2) | U.S. withdrew (2017–2021; re-joined 2021; withdrew again 2025) |
| Current Status | Active commitment periods ended; succeeded by Paris | Current primary global climate framework |
Which Is Better?
Neither treaty is perfect. Each represents a product of its political moment.
The Kyoto Protocol had real legal teeth – binding targets, genuine enforcement, and market mechanisms that actually worked.
But it was too narrow. By covering only industrialized countries, it missed the majority of global emissions.
The Paris Agreement is universal – virtually every country on Earth has joined.
But it relies on voluntary compliance. Countries set their own targets. There is no legal penalty for missing them.
Many climate experts argue the ideal framework would combine the universality of Paris with the enforceability of Kyoto.
That debate continues to shape global climate negotiations today.
The Kyoto Protocol’s Three Key Carbon Units: A Plain-English Guide
Carbon accounting under the Kyoto Protocol involved a system of tradable units that many people find confusing.
Here is a simple breakdown.
| Unit | Full Name | How Generated | Who Can Hold It | Used For |
|---|---|---|---|---|
| AAU | Assigned Amount Unit | Allocated to Annex I countries based on Kyoto targets | Annex I governments | Compliance under IET |
| RMU | Removal Unit | Earned through land use, forests absorbing CO₂ (LULUCF) | Annex I governments | Compliance under IET |
| CER | Certified Emission Reduction | Generated by CDM projects in developing countries | Governments, companies | Meeting Kyoto targets |
| ERU | Emission Reduction Unit | Generated by JI projects between Annex I countries | Annex I governments | Compliance |
| tCER | Temporary CER | From forestry CDM projects; expires after commitment period | Governments | Compliance (with replacement obligation) |
| lCER | Long-term CER | From forestry CDM projects; valid for full crediting period | Governments | Compliance (with replacement obligation) |
All units were equal to one metric tonne of CO₂ equivalent.
Each unit was tracked in national registries – electronic databases that recorded the issuance, holding, transfer, and cancellation of every unit.
The UNFCCC maintained an International Transaction Log (ITL) that connected all national registries and checked every transaction automatically to prevent double-counting, fraud, or issuance beyond allowed limits.
This was, in essence, the world’s first international carbon accounting system.
The Clean Development Mechanism: A Deeper Dive
The CDM deserves special attention because it was the most far-reaching and controversial of the Kyoto mechanisms, and its legacy continues to shape global carbon markets today.
The CDM Project Cycle
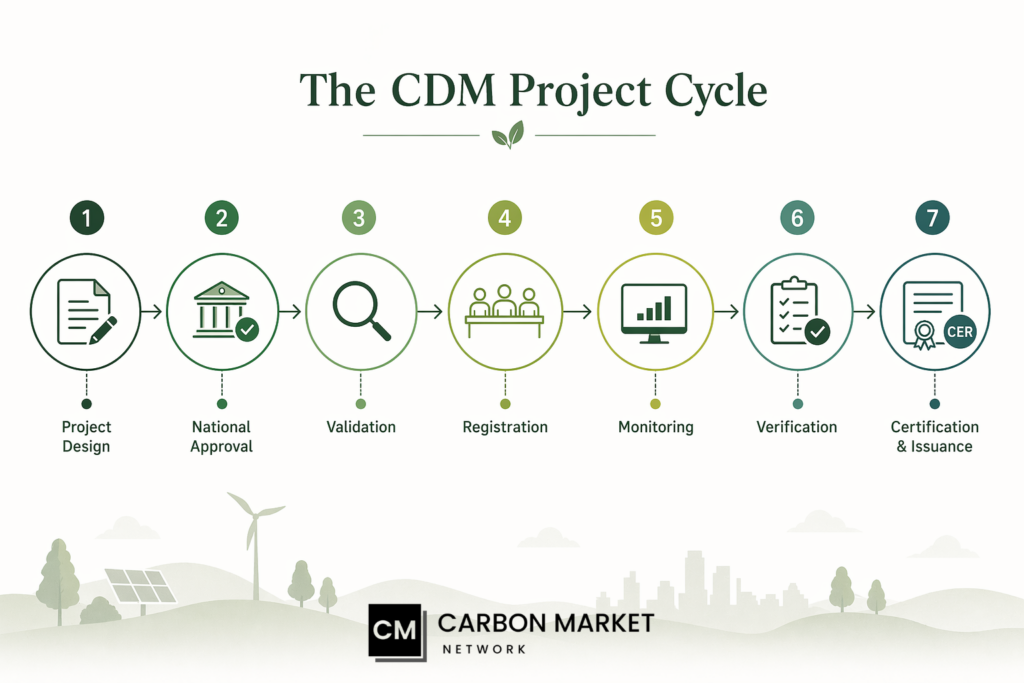
Getting a project registered as a CDM project was a multi-step process:
Step 1: Project Design The project developer creates a Project Design Document (PDD) that describes the project, the baseline (what emissions would have been without the project), the methodology for calculating reductions, and how it contributes to sustainable development.
Step 2: National Approval The host country’s Designated National Authority (DNA) issues a Letter of Approval confirming the project promotes sustainable development.
Step 3: Validation An independent Designated Operational Entity (DOE) reviews the PDD against CDM rules and validates it.
Step 4: Registration The CDM Executive Board reviews and registers the project.
Step 5: Monitoring The project developer monitors actual emission reductions and produces a monitoring report.
Step 6: Verification A DOE independently verifies the monitoring report.
Step 7: Certification and Issuance The CDM Executive Board issues CERs – one for each tonne of CO₂e reduced and verified.
CDM by the Numbers
| Metric | Data |
|---|---|
| CERs issued (total, to date) | Over 2 billion |
| CDM projects registered | Over 7,800 |
| Countries hosting CDM projects | Over 100 |
| Largest hosting country | China (~50% of all CERs) |
| Emission reductions generated (CP1) | Over 1.5 billion tonnes CO₂e |
| Private sector investment mobilized | Tens of billions of USD |
| Most common project type | Renewable energy (wind, hydro, solar) |
CDM Controversies
Despite its scale, the CDM attracted serious criticism:
Additionality problems: Multiple studies found that a significant share of CDM projects – potentially over 50% in some analyses – were not truly additional. The reductions would have occurred anyway.
HFC-23 scandal: Plants in China and India earned massive CDM revenues by destroying HFC-23 gas, leading to perverse incentives to produce more of the parent compound (HCFC-22) just to destroy it and earn credits.
Concentration in wealthy developing countries: Most CDM projects ended up in China, India, Brazil, and a handful of other middle-income countries. Least Developed Countries (LDCs) and Africa received very little CDM investment.
Slow bureaucracy: The project approval process was slow, complex, and costly – effectively excluding small-scale and community-level projects.
These lessons directly informed the design of Article 6.4 (the Sustainable Development Mechanism) under the Paris Agreement, which includes stricter additionality and environmental integrity standards.
The Kyoto Protocol’s Legacy: What It Left Behind
The Kyoto Protocol officially ended as an active treaty framework when its second commitment period closed on December 31, 2020, and was formally wound up at COP28 in late 2023.
But its legacy is enormous and very much alive.
Legacy 1: The Carbon Market Architecture
Every carbon market operating today traces its design heritage to Kyoto.
The EU ETS, launched in 2005, was built on Kyoto’s principles and units.
The voluntary carbon market’s project standards (Gold Standard, Verra’s VCS) evolved from the CDM methodology system.
Article 6 of the Paris Agreement, which governs international carbon trading today, is explicitly modeled on and designed to improve upon – the Kyoto Protocol’s flexibility mechanisms.
Legacy 2: The MRV Standard
Kyoto created the world’s most rigorous multilateral system for measuring, reporting, and verifying greenhouse gas emissions.
Annual GHG inventories, common reporting formats, independent expert review teams, international transaction logs – all of these became the global standard for climate accountability.
The Paris Agreement’s Enhanced Transparency Framework (ETF) was built directly on Kyoto’s MRV infrastructure.
Legacy 3: The Principle of Climate Finance
Kyoto formally established that developed countries had an obligation to support developing countries financially and technologically in addressing climate change.
This principle has evolved into the Green Climate Fund, the calls for a $100 billion annual climate finance commitment (which the world still struggles to fully deliver), and the emerging New Collective Quantified Goal (NCQG) on climate finance under the Paris Agreement.
Legacy 4: Proof That Binding Targets Work
Perhaps the most important legacy: Kyoto proved that countries can accept legally binding climate commitments and actually meet them.
Countries in both commitment periods broadly met or exceeded their targets.
This demolished the argument that binding international climate commitments are economically or politically unachievable.
Legacy 5: The Lessons That Shaped the Paris Agreement
The Paris Agreement was explicitly designed with Kyoto’s failures in mind.
| Kyoto Failure | Paris Agreement Response |
|---|---|
| Only covered industrialized countries | Universal participation; all countries submit NDCs |
| Targets imposed top-down | Bottom-up; each country sets its own targets |
| U.S. never ratified due to developing country exemption | U.S. included from the start; developing countries have NDCs |
| Fixed targets for set periods | Ratchet mechanism; NDCs must be progressively more ambitious |
| Strict enforcement damaged political participation | No punitive enforcement; relies on transparency and peer pressure |
| CDM had additionality and integrity issues | Article 6.4 (SDM) has stricter environmental integrity standards |
What Came After the Kyoto Protocol? The Paris Agreement and Beyond
The Paris Agreement (2015)
The Paris Agreement was adopted at COP21 in Paris, France, on December 12, 2015, and entered into force on November 4, 2016.
It replaced the Kyoto Protocol as the world’s primary international climate framework.
Key features:
- Universal participation – nearly every country on Earth
- NDCs submitted and updated every five years
- Global temperature goal: well below 2°C; pursuing 1.5°C
- Global Stocktake every five years to assess collective progress
- Enhanced Transparency Framework for accountability
- Loss and Damage recognition (formalized at COP27 in 2022)
- Climate finance commitments
Current status (as of April 2026):
Under current NDCs, global warming is projected to reach approximately 2.5°C to 2.8°C above pre-industrial levels by 2100 – far above the 1.5°C target.
Countries are under enormous pressure to strengthen their NDCs. The second global stocktake process is underway in 2025–2026 and will assess whether current national pledges are sufficient.
Article 6 Carbon Markets Under the Paris Agreement
Article 6 of the Paris Agreement sets out new frameworks for international carbon trading.
| Article 6 Provision | Description | Kyoto Equivalent |
|---|---|---|
| Article 6.2 | Bilateral/multilateral carbon trading between countries; generates Internationally Transferred Mitigation Outcomes (ITMOs) | International Emissions Trading (IET) |
| Article 6.4 | Centralized UN-supervised carbon crediting mechanism; generates Article 6.4 Emission Reductions (A6.4ERs) | Clean Development Mechanism (CDM) |
| Article 6.8 | Non-market approaches to international climate cooperation | No direct equivalent |
The Article 6.4 mechanism (Sustainable Development Mechanism or SDM) began operationalizing in 2024, with the UNFCCC’s Supervisory Body approving key methodological standards at COP29 in Baku.
This is the long-awaited successor to the CDM.
COP28 (Dubai, 2023) and COP29 (Baku, 2024): Key Developments
At COP28 in Dubai (November–December 2023):
- The first Global Stocktake concluded, finding that countries are not on track to meet Paris Agreement goals
- A historic agreement to “transition away” from fossil fuels was reached
- The Kyoto Protocol’s second commitment period was formally closed
At COP29 in Baku (November 2024):
- A new climate finance goal was agreed – the New Collective Quantified Goal (NCQG) – committing developed countries to mobilize at least $300 billion per year for developing countries by 2035
- Article 6.4 methodological standards were advanced, bringing the SDM closer to operation
- Countries agreed on rules for Article 6.2 bilateral carbon trading
COP30 is scheduled for Belém, Brazil, in November 2025 – a major moment for NDC updates and climate ambition.
Key Lessons the Kyoto Protocol Taught the World
The Kyoto Protocol was a living experiment in international climate governance – the first of its kind. It taught the world lessons that no amount of theoretical modeling could have produced.
Lesson 1: Legally binding targets can be set and met. Kyoto’s participating countries broadly met their commitments. This showed the world that binding international climate obligations are achievable.
Lesson 2: A global problem requires a global solution. By excluding major emitters, Kyoto proved that partial solutions cannot solve universal problems. The Paris Agreement was designed with this lesson front and center.
Lesson 3: Carbon markets work, but require careful design. The CDM and EU ETS demonstrated that carbon pricing can deliver genuine emission reductions at scale. But they also revealed serious pitfalls – additionality failures, perverse incentives, and market manipulation – that require rigorous design and oversight.
Lesson 4: Developing countries need incentives, not just obligations. The CDM showed that climate investment flows to where the incentives are. The key is designing the right incentives – ones that deliver genuine climate outcomes while supporting sustainable development.
Lesson 5: Transparency is non-negotiable. Kyoto’s MRV system proved that credible, third-party-verified reporting is essential for building the trust needed for international climate cooperation.
Lesson 6: Enforcement without universal buy-in creates unfair competition. Countries like Canada argued – with some justification – that accepting binding commitments while competitors like the U.S. and China did not put them at an economic disadvantage. The Paris Agreement’s universality was designed to address this concern.
Lesson 7: Flexibility mechanisms must be paired with domestic ambition. Allowing countries to buy their way to compliance without cutting emissions at home risks becoming a workaround rather than a solution. The Paris Agreement’s NDC architecture tries to ensure domestic action remains central.
Lesson 8: Political continuity matters. The Kyoto Protocol’s story shows how vulnerable long-term climate commitments are to changes in government. Canada ratified and withdrew. The U.S. signed and rejected. The Paris Agreement’s bottom-up structure was designed to make withdrawal less consequential – though that too has been tested by political changes.
Frequently Asked Questions About the Kyoto Protocol
Q1 What is the Kyoto Protocol in simple terms?
The Kyoto Protocol is the world’s first international treaty that legally required industrialized countries to reduce their greenhouse gas emissions by specific percentages compared to 1990 levels. Think of it as a binding contract between nations – one where violating the contract had actual legal consequences.
Q2. When was the Kyoto Protocol adopted, and when did it enter into force?
The Kyoto Protocol was adopted on December 11, 1997 in Kyoto, Japan. Due to a complex ratification requirement – it needed ratification by countries representing at least 55% of Annex I CO₂ emissions – it did not enter into force until February 16, 2005, eight years after its adoption.
Q3. Is the Kyoto Protocol still in effect in 2026?
The Kyoto Protocol still exists as a legal instrument, but its active commitment periods have ended. The first ran from 2008 to 2012. The second ran from 2013 to 2020.
The second commitment period was formally closed at COP28 in December 2023. The Paris Agreement, in force since 2016, now serves as the world’s primary climate framework.
Q4. Did the Kyoto Protocol succeed or fail?
Both, honestly. Within its scope, it largely succeeded. Participating countries met and exceeded their emission reduction targets. The EU reduced emissions by 31% by 2020 relative to 1990. The second-period group achieved a 28% reduction overall. But globally, it failed to stop emissions rising, because the world’s largest emitters – the U.S., China, India – were not bound by its targets. Global CO₂ concentrations rose every single year throughout the Kyoto era.
Its true success may lie in the institutional, financial, and normative infrastructure it created – all of which continues to underpin global climate action today.
Q5. Why did the United States never ratify the Kyoto Protocol?
The U.S. Senate passed the Byrd-Hagel Resolution in 1997 by 95-0, signaling it would not ratify any climate treaty that exempted major developing countries from binding commitments. The Clinton administration signed the protocol but never submitted it for ratification. The Bush administration formally rejected it in 2001, citing concerns about economic competitiveness and the exclusion of China and India.
Q6. What is the difference between the Kyoto Protocol and the Paris Agreement?
The Kyoto Protocol imposed binding emission targets on industrialized countries only, with top-down negotiated percentages and real enforcement penalties. The Paris Agreement is universal – all countries participate – but uses self-determined, bottom-up targets (NDCs) that are not legally enforceable in the same way. Kyoto was narrower but stricter; Paris is broader but more flexible.
Q7. What were the three flexibility mechanisms of the Kyoto Protocol?
The three mechanisms were: International Emissions Trading (IET) – a cap-and-trade system between Annex I countries; the Clean Development Mechanism (CDM) – which allowed developed countries to earn carbon credits by funding clean projects in developing countries; and Joint Implementation (JI) which allowed one developed country to fund emission reduction projects in another developed country and receive tradable credits.
Q8. What is the Clean Development Mechanism (CDM)?
The CDM allowed developed (Annex I) countries to invest in emission reduction projects in developing (non-Annex I) countries and receive Certified Emission Reductions (CERs) in return. Each CER represented one tonne of CO₂ equivalent reduced. These CERs could be used to meet Kyoto targets. The CDM generated over 1.5 billion tonnes of CO₂e in reductions between 2001 and 2012 and channeled billions of dollars in clean energy investment to developing countries.
Q9. What was the Doha Amendment?
The Doha Amendment was adopted at COP18 in Doha, Qatar, in December 2012. It established the Kyoto Protocol’s second commitment period (2013–2020) and set a new collective target of at least 18% below 1990 levels for participating parties. It entered into force on December 31, 2020, after 147 parties deposited instruments of acceptance.
Q10. How many countries are parties to the Kyoto Protocol?
At its peak, the Kyoto Protocol had 192 Parties. The United States signed but never ratified it. Canada formally withdrew in December 2012.
Q11. What greenhouse gases does the Kyoto Protocol cover?
The Kyoto Protocol originally covered six greenhouse gases: carbon dioxide (CO₂), methane (CH₄), nitrous oxide (N₂O), hydrofluorocarbons (HFCs), perfluorocarbons (PFCs), and sulfur hexafluoride (SF₆). The Doha Amendment added nitrogen trifluoride (NF₃) in the second commitment period.
Q12. What replaced the Kyoto Protocol?
The Paris Agreement, adopted in December 2015 and in force since November 2016, replaced the Kyoto Protocol as the world’s primary international climate framework. Under Paris, all countries submit Nationally Determined Contributions (NDCs) and update them every five years with increasing ambition.
Q13. What is the legacy of the Kyoto Protocol?
The Kyoto Protocol’s legacy includes: creating the world’s first legally binding climate commitments and proving they can be met; building the global carbon market architecture; establishing the MRV systems for climate accounting; demonstrating that climate finance can flow from developed to developing countries; and providing the institutional foundation and political lessons that shaped the Paris Agreement.
Conclusion
The Kyoto Protocol will remain one of the most important and most debated international agreements in history.
It was the world’s first legally binding climate treaty. It made rich countries put their commitments in writing, with penalties attached. And the countries that signed up, by and large, delivered.
Yes, it left out too many of the world’s biggest emitters. Yes, its carbon market mechanisms had flaws that took years to recognize and correct. Yes, global emissions rose throughout its life.
But the Kyoto Protocol did something no international treaty had done before: it proved that sovereign nations can accept hard, legally binding climate obligations and meet them.
The EU reduced its emissions by 31% by 2020 compared to 1990. The second-period group collectively achieved a 28% reduction. That is not a footnote. That is proof.
The carbon markets Kyoto built now trade hundreds of billions of dollars per year. The reporting systems it created now underpin global climate accountability. The principles it established now live in every line of the Paris Agreement.
The world still has a vast distance to cover. Current Paris Agreement commitments put the planet on track for warming well above the 1.5°C target. The gap between ambition and action remains dangerously wide.
But when historians write the story of how humanity learned to fight climate change together – the Kyoto Protocol will be the chapter where it all began.
Understanding the Kyoto Protocol means understanding where we started, what we learned, and why the stakes of getting global climate governance right have never been higher.