Carbon Market Network


What gets measured, gets managed. And in 2026, companies that measure the right sustainability metrics are the ones building resilient businesses, attracting investors, and staying ahead of tightening regulations worldwide.
Sustainability is no longer a “nice-to-have” checkbox on a corporate responsibility report. It has become a core business function. From the European Union’s Corporate Sustainability Reporting Directive (CSRD) to new climate disclosure rules in Singapore, Hong Kong, Australia, and California, governments and regulators around the world are demanding that companies back their sustainability claims with solid, verifiable data.
But here is the challenge — there are hundreds of possible sustainability metrics out there. Which ones actually matter? Which ones will help your company reduce risk, cut costs, and build trust with stakeholders?
This guide answers exactly that. Whether you are just starting your sustainability journey or refining an existing ESG reporting program, this article walks you through the key sustainability metrics every company should track, why they matter, and how to use them effectively.
What Are Sustainability Metrics?
Sustainability metrics are specific, measurable data points that reflect how your organization performs on environmental, social, and governance (ESG) issues.
Think of them as the language your business uses to prove — not just promise — that it is operating responsibly. They turn broad commitments like “we want to reduce our carbon footprint” into trackable numbers like “we reduced our Scope 1 emissions by 18% year-on-year.”
Sustainability metrics, ESG metrics, and ESG KPIs are closely related but have distinct meanings:
- ESG data is the raw input — your electricity bill, your HR training logs, your waste disposal receipts.
- ESG metrics are what you get when that raw data is standardized and structured — for example, energy use per square meter of office space.
- ESG KPIs (Key Performance Indicators) are metrics tied to a specific target — for example, reduce energy intensity by 15% by 2027.
Every KPI is a metric, but not every metric needs to be a KPI. The best sustainability programs focus on a tight, well-chosen set of metrics that genuinely drive decisions.
Carbon Market Insider Newsletter
Weekly insights on carbon markets, climate policy, carbon credits, and sustainability.
Why Sustainability Metrics Matter More Than Ever in 2026
The business case for tracking sustainability metrics has never been stronger. Here is what the data shows right now.
Around 90% of S&P 500 companies now release ESG reports, and 76% of executives say sustainability is central to business strategy.
Companies reporting clearer sustainability data are being rewarded with a lower cost of capital and higher equity valuations.
Physical climate risk is becoming a balance-sheet issue, with MSCI estimating that the share of infrastructure assets facing catastrophic losses could increase roughly fivefold by 2050.
From a regulatory standpoint, the pressure is enormous and growing:
- From January 2026, Hong Kong requires large listed issuers to mandatorily disclose Scope 3 greenhouse gas emissions under HKEX’s enhanced ESG framework.
- From January 2026, all banks and insurance companies regulated by the Qatar Central Bank are required to prepare and submit annual sustainability reports in line with the ISSB’s IFRS S1 and IFRS S2 standards.
- California’s mandatory climate reporting began in January 2026 after moving forward despite legal challenges.
- In December 2019, China published its first national climate-reporting standard for Corporate Sustainable Disclosure, aligned with the IFRS/ISSB climate disclosure framework, designed to support a transparent, low-carbon economy.
Beyond compliance, investor expectations are accelerating the shift. Around 47% of investors cite ESG data coverage gaps as their biggest challenge, and 41% report data quality issues and inconsistencies across providers.
The message is clear: reliable sustainability metrics are now a business imperative, not a voluntary add-on.
The Three Pillars of Sustainability Metrics
All sustainability metrics fall under one of three core pillars, which together make up the ESG framework.
Environmental Metrics
These measure your company’s impact on the natural world — climate, energy, water, waste, and biodiversity.
Social Metrics
These measure your company’s impact on people — employees, communities, supply chains, and customers.
Governance Metrics
These measure how your company is led and managed — board composition, ethics, transparency, and executive accountability.
Each pillar has its own set of critical metrics. Let us explore them in depth.
Environmental Sustainability Metrics Every Company Should Track
1. Greenhouse Gas Emissions (Scope 1, 2, and 3)
This is the most important sustainability metric for the vast majority of companies today.
Greenhouse gas (GHG) emissions are classified into three scopes. Scope 1 covers direct emissions from company-owned or controlled sources. Scope 2 covers indirect emissions from purchased electricity, steam, heating, or cooling. Scope 3 covers all other indirect emissions from the value chain, including suppliers and customers.
Why it matters:
Scope 3 emissions deserve special attention. These indirect emissions — from suppliers, transportation, product use, and other parts of the value chain — typically account for more than 75% of a company’s total emissions.
Yet today, more than 40% of companies measure Scope 1 and 2 emissions, but far fewer are able to track Scope 3. The main barrier, cited by about 70% of surveyed companies, is a lack of data from suppliers.
How to track it:
- Use the GHG Protocol Corporate Standard as your measurement framework.
- Measure in metric tons of CO₂ equivalent (CO₂e).
- Track both absolute emissions (total tonnes) and intensity emissions (tonnes per unit of revenue or production).
- Report through the Carbon Disclosure Project (CDP) for global comparability.
Real-world example:
Walmart’s “Project Gigaton” aims to cut one billion metric tonnes of emissions across its entire supply chain, which is one of the most ambitious Scope 3 reduction programs in corporate history.
Actionable takeaway: Start with Scope 1 and Scope 2 first, then build toward Scope 3. Companies that actively engage their suppliers are 9 times more likely to achieve their Scope 3 targets, yet two-thirds of companies still do not do this.
2. Energy Consumption and Renewable Energy Percentage
Your energy use sits at the heart of your environmental footprint.
This metric tracks total energy consumed across your operations — electricity, gas, fuel — and, critically, what percentage of that energy comes from renewable sources like solar, wind, or hydropower.
Why it matters:
Energy efficiency directly reduces operating costs. Transitioning to renewables cuts emissions and future-proofs your business against rising fossil fuel prices and carbon pricing.
How to track it:
- Measure total energy consumption in kilowatt-hours (kWh) or gigajoules (GJ).
- Calculate energy intensity: kWh per unit of revenue, per square meter of space, or per unit produced.
- Track the renewable energy percentage as a share of total energy consumption.
- Set science-based targets for year-on-year improvement.
Real-world example:
IKEA’s parent company Ingka Group reduced its climate footprint by 30% since 2016. This was achieved through retrofitting buildings, switching to renewable energy, and tracking carbon emissions across all operations, all while continuing to grow revenue.
3. Carbon Intensity
Carbon intensity measures how efficiently your business produces each unit of output relative to its emissions.
It is calculated as the ratio of GHG emissions to either revenue or production volume. For example, 0.5 metric tons of CO₂e per million dollars of revenue.
Why it matters:
Absolute emissions can drop simply because a company shrinks. Carbon intensity tells you whether your business is genuinely becoming cleaner as it grows, which is what investors and regulators actually want to see.
Actionable takeaway: Set both absolute reduction targets and intensity reduction targets. The combination gives a complete picture of your decarbonization trajectory.
4. Water Withdrawal and Water Intensity
Water scarcity is a rapidly growing business risk. Following the rapid adoption of the Taskforce on Nature-related Financial Disclosures (TNFD), leading companies are now managing “nature positive” impacts by treating local water basins and ecosystems as a single, critical asset class.
What to track:
- Total water withdrawal by source (municipal supply, groundwater, surface water, rainwater).
- Water consumption — what is actually consumed versus returned to the source.
- Water intensity — liters or cubic meters per unit of production or revenue.
- Water use in water-stressed regions (a critical disclosure for CSRD and TNFD reporting).
Why it matters:
For food and beverage companies, semiconductor manufacturers, textile producers, and many others, water is both a critical input and a major regulatory risk. A company that cannot demonstrate responsible water stewardship faces supply chain disruption, regulatory fines, and reputational damage.
Real-world example:
Beverage companies like Coca-Cola and AB InBev report detailed water stewardship metrics because their entire business depends on reliable water access. They track not just how much water they use, but how much they return to watersheds in water-stressed areas.
5. Waste Generation and Diversion Rate
This metric tracks the total waste your operations generate and the percentage of that waste that is diverted from landfills through recycling, reuse, composting, or energy recovery.
Key metrics to track:
- Total waste generated (in tonnes)
- Percentage of waste recycled or composted
- Hazardous waste generated separately from non-hazardous waste
- Landfill diversion rate (the percentage of total waste kept out of landfills)
Why it matters:
A high landfill diversion rate signals a commitment to the circular economy. It also reduces waste disposal costs and protects companies from tightening landfill bans and extended producer responsibility (EPR) regulations.
Actionable takeaway: A fashion retailer, for instance, might aim to recycle 40% or more of textile waste through resale and take-back programs, reducing both costs and regulatory exposure.
6. Biodiversity and Land Use
Biodiversity loss is moving from a peripheral concern to a core business metric.
Biodiversity impact and nature protection are now becoming core business metrics, driven by the Global Biodiversity Framework and the growing influence of the Taskforce on Nature-related Financial Disclosures (TNFD).
What to track:
- Land area affected or restored by operations
- Deforestation rate linked to your supply chain
- Proximity of operations to biodiversity-sensitive or protected areas
- Percentage of suppliers compliant with no-deforestation commitments
Why it matters:
The EU’s deforestation regulation (EUDR) is expected to become effective for larger companies by the end of 2026 and mid-2027 for smaller companies. It requires businesses selling agricultural commodities in or through the EU to demonstrate that products do not come from deforested land.
Companies in mining, agriculture, real estate, and food production face the most immediate pressure here, but all businesses with complex supply chains need to map their nature-related risks.
7. Carbon Credits and Carbon Offsetting Activity
For companies pursuing net-zero goals, carbon credits are an important sustainability metric to track alongside emission reductions.
A carbon credit represents the verified reduction or removal of one metric ton of CO₂e from the atmosphere. Companies use them to offset residual emissions that cannot yet be eliminated through operational changes.
What to track:
- Volume of carbon credits purchased (in metric tons CO₂e)
- Types of carbon credits (nature-based, technology-based, direct air capture)
- Credit quality and verification standard (Verra VCS, Gold Standard, etc.)
- Net position: absolute emissions minus verified offsets
Why it matters:
The carbon credit market is growing rapidly. The global carbon credit trading service market was valued at USD 308.69 billion in 2025 and is projected to grow significantly through the decade, driven by rising global carbon emission regulations, increasing corporate net-zero commitments, and expanding carbon pricing mechanisms.
However, tracking credits alone is not enough. Investors and regulators want to see that your offsetting strategy complements genuine emission reductions, not replaces them. The era of using cheap, low-quality offsets to claim “carbon neutrality” is ending fast.
Actionable takeaway: Follow the mitigation hierarchy: reduce first, then offset residual emissions with high-quality, verified carbon credits that align with the Oxford Principles for Net Zero Aligned Carbon Offsetting.
Social Sustainability Metrics Every Company Should Track
8. Workforce Diversity, Equity, and Inclusion (DEI)
Diversity metrics measure representation across gender, ethnicity, age, and disability at all levels of the organization, particularly in leadership and board roles.
Key metrics to track:
- Percentage of women in total workforce and in leadership/executive roles
- Representation of underrepresented ethnic groups in leadership
- Pay equity ratio — comparing compensation across gender and ethnicity
- Employee engagement and satisfaction scores tied to inclusion
Why it matters:
Research consistently shows that diverse leadership teams make better decisions, attract broader talent, and deliver stronger financial performance. Investors now routinely flag companies with poor diversity disclosures as higher-risk investments.
Real-world example:
A technology company might report that women now make up 30% of executive roles, up from 20% in the prior year, tying this progress to explicit DEI hiring and promotion targets.
9. Employee Health, Safety, and Well-Being
Workplace safety is one of the oldest and most universally tracked ESG metrics. It remains critically important.
Key metrics to track:
- Total Recordable Incident Rate (TRIR) — the number of work-related injuries per 100 full-time workers per year
- Lost Time Injury Rate (LTIR)
- Fatalities in the workplace
- Mental health support programs offered
- Employee absenteeism rates
Why it matters:
For industries like manufacturing, mining, construction, and logistics, safety performance is directly linked to regulatory compliance, insurance costs, and worker retention. A single serious incident can result in regulatory shutdowns, massive fines, and lasting reputational damage.
Actionable takeaway: Track leading indicators (safety training completion rates, near-miss reports) alongside lagging indicators (injury rates). Leading indicators help you prevent accidents before they happen.
10. Employee Turnover and Retention Rate
This metric measures the percentage of employees who leave your organization within a given period, either voluntarily or involuntarily.
Why it matters:
Workforce turnover data allows investors to track performance on employee retention, and it is increasingly viewed as a metric with demonstrable links to financial performance.
High turnover drives up recruitment and training costs, reduces institutional knowledge, and often signals underlying issues with workplace culture, compensation, or leadership.
Key metrics to track:
- Overall voluntary turnover rate
- Turnover disaggregated by gender, seniority level, and business unit
- Average employee tenure
- Internal promotion rate (an indicator of career development)
11. Training and Skill Development Hours
This metric tracks the average number of hours of training each employee receives per year, as well as investment in skill development programs.
Why it matters:
In 2026, cross-functional ESG fluency, particularly in finance, procurement, and operations, is becoming a strategic asset, and the skills gap around sustainability is now considered a business risk.
Companies that invest in upskilling their workforce on sustainability build internal capability, reduce dependence on external consultants, and integrate ESG thinking into everyday decision-making.
12. Supply Chain Social Standards and Compliance
Modern slavery, child labor, unsafe working conditions, and unfair wages in supply chains represent both a serious ethical issue and a growing legal risk.
Key metrics to track:
- Percentage of key suppliers audited for labor, safety, and environmental standards
- Supplier ESG risk assessment coverage
- Number of corrective actions issued to suppliers
- Percentage of suppliers meeting your ESG criteria
Why it matters:
63% of companies treat sustainability as a board-level priority, yet only 19% report full visibility across their supply chains. That gap between board-level intention and supply chain reality is one of the defining ESG challenges of 2026.
Actionable takeaway: Start by mapping your Tier 1 (direct) suppliers. Then progressively extend audits to Tier 2 and beyond. Use supplier scorecards to create accountability and reward top performers.
13. Community Investment and Social Impact
This metric tracks your company’s investment in the communities where it operates — through charitable giving, volunteering programs, infrastructure investment, and local employment.
Key metrics to track:
- Total community investment as a percentage of revenue or pre-tax profit
- Employee volunteering hours per person
- Number of local jobs created
- Social return on investment (SROI) for key community programs
14. Data Privacy and Cybersecurity
In the digital economy, data protection is both a governance and a social responsibility issue.
Cybersecurity and data privacy have moved from specialized concerns to top-tier governance KPIs in most industries, with Morningstar Sustainalytics adding a dedicated cybersecurity material ESG issue in its 2026 methodology update.
Key metrics to track:
- Number of data breaches reported
- Percentage of employees trained on data privacy and cybersecurity
- Time to detect and respond to security incidents
- Compliance with data protection regulations (GDPR, PDPA, etc.)
Governance Sustainability Metrics Every Company Should Track
15. Board Composition and Independence
Board diversity and independence are foundational governance metrics. They signal whether your company has the oversight structures needed to make responsible long-term decisions.
Key metrics to track:
- Percentage of independent board directors
- Board gender diversity (percentage of women on the board)
- Board expertise in ESG, climate, and sustainability
- Average board tenure (very long tenures can signal a lack of fresh perspectives)
Why it matters:
An independent, diverse board is more likely to challenge management on short-term thinking, hold leadership accountable to sustainability targets, and build stakeholder trust.
16. Executive Compensation Tied to ESG Performance
This governance metric measures the degree to which leadership incentives are aligned with sustainability goals.
Why it matters:
When executive bonuses depend partly on ESG performance, sustainability stops being someone else’s problem. It becomes every leader’s priority.
Key metrics to track:
- Percentage of executive compensation linked to ESG KPIs
- Which ESG goals are used (carbon reduction, safety targets, diversity goals)
- Alignment between stated ESG targets and compensation criteria
Real-world example:
A banking firm might tie 20% of executive bonuses to carbon-reduction goals. This creates a direct financial incentive for the leadership team to drive real climate action across the business.
17. Ethics, Anti-Corruption, and Business Conduct
These metrics measure your company’s commitment to operating with integrity.
Key metrics to track:
- Number of confirmed corruption or bribery cases
- Percentage of employees who have completed ethics and anti-corruption training
- Number of whistleblower reports filed and resolved
- Anti-bribery and anti-corruption policy coverage across operations and key suppliers
Why it matters:
Corruption incidents destroy shareholder value, trigger regulatory investigations, and permanently damage brand reputation. Companies with strong ethics training and transparent whistleblower programs catch issues early and demonstrate good governance to investors.
18. Transparency and ESG Disclosure Quality
This metric measures the comprehensiveness, accuracy, and timeliness of your sustainability disclosures.
Key metrics to track:
- Adherence to recognized frameworks (GRI, SASB, ISSB, CSRD/ESRS, TCFD)
- Third-party assurance of sustainability data
- Timeliness of annual sustainability report publication
- Percentage of ESG metrics independently verified
Why it matters:
In 2026, companies that can demonstrate measurable, credible progress will stand out in an increasingly data-driven sustainability landscape. Investors and regulators are moving rapidly toward requiring assured, auditable sustainability data — not just self-reported narratives.
Demand for assured product sustainability data is surging, with 35% of FTSE 250 companies publishing assurance opinions covering product sustainability claims in 2026.
19. Sustainability-Linked Financial Products and Green Revenue
For companies actively engaging with sustainable finance, this metric tracks your engagement with green bonds, sustainability-linked loans, and green revenue streams.
Key metrics to track:
- Volume of green bonds or sustainability-linked loans issued
- Percentage of revenue from products or services that meet green criteria
- Alignment of financing with recognized taxonomies (EU Taxonomy, ISSB)
Why it matters:
Banks use ESG KPIs to price sustainability-linked loans and bonds, where interest rates move based on KPI performance, and companies with robust ESG reporting typically face lower financing costs than peers with weak tracking.
The Key Sustainability Reporting Frameworks You Need to Know
Picking the right framework is just as important as picking the right metrics. Here is a quick overview of the major frameworks shaping sustainability reporting.
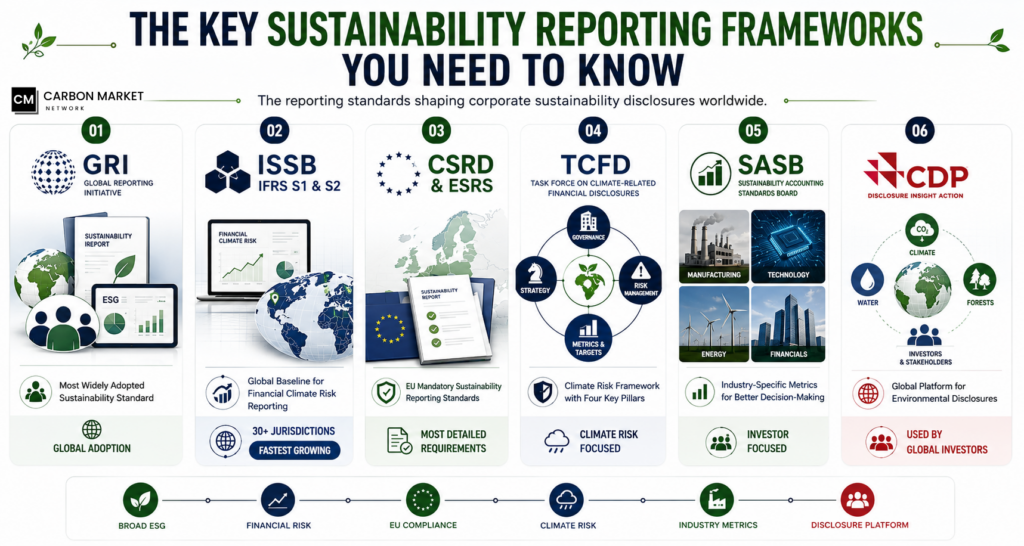
GRI (Global Reporting Initiative)
The most widely adopted sustainability reporting standard in the world. GRI adoption in the Americas has remained broadly stable, reflecting continued relevance for companies seeking comprehensive coverage of sustainability disclosures. GRI is particularly useful for multi-stakeholder reporting covering the full breadth of ESG impacts.
ISSB / IFRS S1 and S2
The International Sustainability Standards Board has created a global baseline for financial climate risk reporting. More than 30 jurisdictions are moving toward mandatory IFRS S1 and S2 reporting, making these the fastest-growing standards globally.
CSRD and ESRS
The EU’s Corporate Sustainability Reporting Directive, paired with the European Sustainability Reporting Standards (ESRS), sets the most detailed mandatory sustainability disclosure requirements in the world. Under the revised framework, companies with over 1,000 employees and €450 million turnover must report on sustainability.
TCFD (Task Force on Climate-related Financial Disclosures)
Standalone TCFD reporting is being phased out as ISSB and ESRS absorb its framework. However, its four pillars — governance, strategy, risk management, and metrics and targets — remain the backbone of modern climate disclosure.
SASB (Sustainability Accounting Standards Board)
SASB provides industry-specific metrics tailored to different sectors. It has been integrated into the IFRS S1 framework, making it highly relevant for investor-focused reporting.
CDP (Carbon Disclosure Project)
CDP is a global platform through which companies disclose climate, water, and forest data. It standardizes climate-related disclosures and is used by thousands of institutional investors worldwide.
How to Start Tracking Sustainability Metrics: A Step-by-Step Approach
Getting started can feel overwhelming. Here is a practical, step-by-step process to build your sustainability metrics program from scratch.
Step 1: Conduct a Materiality Assessment
Before you track anything, figure out what matters most to your specific business.
A materiality assessment identifies the sustainability topics that are most significant for your operations, your stakeholders, and your industry.
Not all sustainability issues are equally material to every business. Water scarcity is critical for a beverage manufacturer but secondary for a software company. Labor practices are paramount in garment manufacturing but less central in semiconductor design.
The CSRD now mandates what is called “double materiality,” which means assessing both:
- Impact materiality: How your company affects people and the environment.
- Financial materiality: How sustainability risks and opportunities affect your company’s financial performance.
Practical steps:
- List all potential ESG topics relevant to your industry.
- Survey key stakeholders — executives, employees, customers, investors, NGOs.
- Map topics by their significance to stakeholders and their financial or operational impact on your business.
- Prioritize the 15 to 25 most material topics.
- Document your methodology carefully for regulatory purposes.
Step 2: Choose Your Reporting Framework
Select the framework or frameworks that match your regulatory obligations, industry, and stakeholder expectations.
For most companies, the right approach combines at least two frameworks — for example, ISSB for investor-facing climate disclosures and GRI for broader multi-stakeholder sustainability reporting.
In 2026, greater alignment across global frameworks, including ISSB, GRI, EFRAG, and TNFD, is helping to standardize impact metrics and supporting integrated reporting that links financial performance with environmental and social outcomes.
Step 3: Define Your Baseline
You cannot measure progress without a starting point.
Collect your baseline data for each material metric. This means gathering historical data on your energy use, emissions, water consumption, safety incidents, workforce demographics, and governance structures.
Use your baseline data to set realistic, science-based targets for improvement over one year, three years, and five years.
Step 4: Build Your Data Collection System
Manual data collection using spreadsheets does not scale. 60% of finance leaders currently struggle with fragmented ESG data across systems, and less than 30% of organizations feel confident in the accuracy of their ESG data.
Invest in purpose-built sustainability software or an integrated ESG data platform that:
- Automates data collection from utility providers, HR systems, and operations.
- Flags data quality issues and inconsistencies.
- Supports multiple reporting frameworks simultaneously.
- Produces audit-ready outputs.
Step 5: Assign Ownership and Governance
Every metric needs an owner. Without clear accountability, sustainability data becomes nobody’s priority.
- Assign each metric to a specific team or individual (operations, HR, procurement, finance).
- Create a cross-functional sustainability committee with representation from all relevant departments.
- Report sustainability metrics to the board or an ESG board committee regularly.
- Consider linking at least a portion of executive compensation to key ESG targets.
Step 6: Report, Benchmark, and Improve
Publish your sustainability metrics in an annual sustainability report or integrated annual report.
Benchmark your performance against industry peers using databases from MSCI, Sustainalytics, CDP, or S&P Global.
Review your metrics annually. Update your materiality assessment every two to three years, or sooner if your business or regulatory environment changes significantly.
Common Mistakes Companies Make When Tracking Sustainability Metrics
Even experienced sustainability teams fall into these traps. Here is what to watch out for.
Trying to track everything at once. One of the most common mistakes is attempting to track everything at once. The result is a data collection burden that overwhelms teams, produces inconsistent quality, and generates reports that bury the most important information in noise. Start focused and expand over time.
Confusing metrics with KPIs. A metric tells you what is happening. A KPI tells you whether you are meeting your goals. Make sure you have clear targets behind every number you report.
Relying on estimates instead of primary data. The era of estimation is ending. Product-level data is becoming mandatory, and companies now stand or fall on their ability to scale verifiable compliance.
Ignoring supply chain data. Most of your environmental and social risk sits outside your direct operations. Limiting your reporting to Scope 1 and Scope 2 emissions or first-tier suppliers gives an incomplete picture.
Greenwashing through selective reporting. Reporting only on your best-performing metrics while hiding areas of underperformance destroys credibility. Stakeholders and regulators are increasingly sophisticated at spotting cherry-picked disclosures.
Leaving sustainability data out of financial reporting. Only around 20% of finance teams currently report on their company’s ESG metrics. This needs to change. Sustainability data belongs in the same reporting workflow as financial data.
Sector-Specific Sustainability Metrics to Consider
Different industries face different material sustainability risks. Here are some of the sector-specific metrics that matter most.
Manufacturing
- Energy intensity per unit produced
- Scope 1, 2, and 3 emissions per unit of output
- Waste generation and recycling rates
- Water intensity per unit produced
- Lost Time Injury Rate for factory workers
Financial Services
- Financed emissions (Scope 3 Category 15) — the emissions linked to the loans, investments, and underwriting your institution provides
- Proportion of green lending or sustainable finance products in your portfolio
- ESG risk integration into credit assessment processes
- Board gender diversity
Retail and Consumer Goods
- Scope 3 supply chain emissions as a percentage of total footprint
- Sustainable packaging percentage
- Supplier audit pass rates for labor and environmental standards
- Product carbon footprint disclosures
- Circular economy metrics (take-back programs, product recyclability)
Technology
- Data center energy efficiency (Power Usage Effectiveness — PUE)
- Renewable energy percentage for data center operations
- Employee diversity and pay equity
- Data breach frequency and resolution time
- AI governance and ethical technology policies
Agriculture and Food
- Land use change and deforestation linked to raw material sourcing
- Water use per tonne of product
- Pesticide and fertilizer intensity
- Percentage of sustainably certified sourcing (Rainforest Alliance, FSC, etc.)
- Food waste generated across the value chain
The Role of AI and Technology in Tracking Sustainability Metrics
Technology is rapidly transforming how companies collect, analyze, and report sustainability data.
81% of executives are already leveraging AI for sustainability, with data automation becoming a strategic asset for improving accuracy and reducing manual reporting burdens.
Modern sustainability platforms can automatically pull data from utility providers, ERP systems, supply chain management tools, and HR software. They validate data in real time, flag anomalies, and generate framework-ready reports in a fraction of the time it takes manually.
AI is also enabling more accurate Scope 3 emissions tracking by building product-level emissions models across complex supply chains — the single most difficult sustainability measurement challenge for most companies.
Practical tools worth exploring:
- Carbon accounting software for automating GHG emissions calculations across all three scopes.
- ESG reporting platforms like Workiva, Sweep, or Watershed for integrated data management and multi-framework reporting.
- Supplier sustainability scorecards for tracking ESG performance across your supply chain.
- Blockchain-based carbon credit platforms for transparent verification of offset transactions.
How Carbon Markets Connect to Your Sustainability Metrics
If you run or are interested in carbon markets, sustainability metrics connect directly to the carbon credit ecosystem.
Carbon credits are only as credible as the data behind them. A company generating or purchasing carbon credits needs robust sustainability metrics to verify additionality (the emissions reduction would not have happened without the project), permanence (the reduction is long-lasting), and measurability (the reduction can be quantified and verified).
- Track your net GHG position (total emissions minus verified offsets).
- Ensure credits you purchase are retired in recognized registries (Verra, Gold Standard, ACR).
- Disclose credit purchases transparently alongside absolute emission reduction progress.
For developers and sellers of carbon credits:
- Measure and report project-level emissions reductions accurately.
- Use internationally recognized monitoring, reporting, and verification (MRV) methodologies.
- Align with emerging standards from the ICVCM (Integrity Council for the Voluntary Carbon Market) for high-integrity credits.
The carbon credit market’s credibility depends on sustainability metrics being accurate, transparent, and independently verified. As regulations tighten, companies that build high-quality, auditable sustainability data systems will have a significant advantage in accessing and participating in carbon markets.
Key Sustainability Metrics Quick Reference
Here is a summary of the sustainability metrics every company should be tracking.
Environmental Metrics:
- Scope 1 GHG emissions (metric tons CO₂e)
- Scope 2 GHG emissions (metric tons CO₂e)
- Scope 3 GHG emissions (metric tons CO₂e)
- Carbon intensity (CO₂e per unit of revenue or production)
- Total energy consumption (kWh or GJ)
- Renewable energy percentage
- Energy intensity
- Total water withdrawal and water intensity
- Water use in water-stressed regions
- Total waste generated
- Landfill diversion rate
- Biodiversity and land use impact
- Carbon credits purchased and retired
Social Metrics:
- Gender diversity in leadership (%)
- Pay equity ratio
- Total Recordable Incident Rate (TRIR)
- Employee turnover rate
- Training hours per employee
- Supplier ESG audit completion rate
- Community investment (% of revenue)
- Number of data breaches
Governance Metrics:
- Board independence percentage
- Board gender diversity
- Executive compensation linked to ESG (%)
- Ethics training completion rate
- Whistleblower reports filed and resolved
- ESG framework alignment and assurance
- Transparency and disclosure quality score
FAQ: Sustainability Metrics
What are sustainability metrics?
Sustainability metrics are specific, measurable data points that reflect a company’s performance on environmental, social, and governance (ESG) issues. They cover areas such as greenhouse gas emissions, energy consumption, water use, workforce diversity, labor practices, board composition, and ethics. Companies use these metrics to track progress, set targets, report to stakeholders, and demonstrate accountability.
What is the difference between sustainability metrics and ESG KPIs?
A sustainability metric is any standardized measurement of ESG performance — for example, total water consumption in cubic meters per year. A KPI (Key Performance Indicator) takes that metric and ties it to a specific goal or threshold — for example, reduce water intensity by 20% by 2028. Every KPI is a metric, but not every metric is a KPI. Companies should focus on a carefully chosen set of material KPIs rather than tracking every possible metric.
What are the most important sustainability metrics for small businesses?
Small businesses should start with the metrics that are most material to their operations. As a starting point, most small businesses benefit from tracking Scope 1 and Scope 2 emissions, total energy consumption, employee safety incidents, workforce diversity, and basic governance indicators like ethics training completion. As capabilities grow, they can expand to Scope 3 emissions and supply chain metrics.
What is a materiality assessment and why does it matter?
A materiality assessment is the process of identifying which sustainability topics are most significant for your specific business and its stakeholders. It determines which metrics you should prioritize tracking and reporting. The CSRD now requires a double materiality assessment for many companies in the EU — covering both the impact of your business on society and the environment, and the impact of sustainability risks on your business’s financial performance.
How do Scope 1, 2, and 3 emissions differ?
Scope 1 emissions are direct emissions from sources your company owns or controls — like combustion in your factories or your company’s vehicle fleet. Scope 2 emissions are indirect emissions from the electricity, steam, or heating you purchase. Scope 3 emissions are all other indirect emissions across your value chain — from the production of goods you buy, the use of your products by customers, and the travel of your employees. Scope 3 typically represents over 75% of a company’s total carbon footprint but is the hardest to measure.
Do all companies need to track sustainability metrics?
The regulatory requirement to disclose sustainability metrics varies by company size, location, and industry. However, regardless of legal requirements, tracking sustainability metrics is increasingly a commercial necessity. Investors use ESG data to assess risk and allocate capital. Customers and supply chain partners require sustainability disclosures. Employees increasingly choose employers with credible sustainability commitments. Companies that track and disclose strong sustainability metrics are better positioned to reduce risk, lower their cost of capital, attract talent, and build long-term business value.
How often should companies report sustainability metrics?
Most sustainability metrics are reported annually in a sustainability report or integrated annual report. However, some metrics — particularly energy consumption, emissions data, and safety statistics — benefit from monthly or quarterly internal tracking. Real-time dashboards are becoming more common as sustainability software matures, allowing management to course-correct throughout the year rather than waiting until year-end.
What is the connection between sustainability metrics and carbon credits?
Carbon credits represent verified emissions reductions or removals, and their integrity depends entirely on rigorous sustainability metrics. Companies buying credits need accurate emissions data to understand their net carbon position. Companies generating credits need precise monitoring, reporting, and verification (MRV) data to prove the emissions reductions are real, measurable, and additional. As the voluntary carbon market grows toward multi-trillion-dollar scale, the quality of underlying sustainability metrics will determine which credits hold their value and which face scrutiny or cancellation.
Conclusion: Track What Matters, Then Act on It
Sustainability metrics are the foundation of credible climate and ESG performance. They transform vague commitments into measurable progress. They give investors confidence, satisfy regulators, and build the kind of long-term trust that drives business value.
The most important thing is to start. You do not need to track every possible metric from day one. Begin with a focused materiality assessment. Pick the 15 to 25 metrics most relevant to your business. Build robust, accurate data collection processes. Set science-based targets. Report transparently.
Then improve — year after year.
Sustainability is no longer a communications exercise or a siloed function. It is a core business capability. The companies that treat sustainability metrics as a genuine management tool, not just a reporting obligation, are the ones that will lead their industries through the transition to a low-carbon, socially responsible economy.
For companies engaged in or exploring carbon markets, sustainability metrics are even more critical. The integrity of carbon credits, the credibility of net-zero claims, and the value of sustainability-linked financing all rest on the quality of the data behind them.
Start tracking the right sustainability metrics today. Your future business value — and the planet — depend on it.
For more expert insights on carbon markets, sustainability metrics, and ESG reporting, explore the resources at Carbon Market Network.