Carbon Market Network


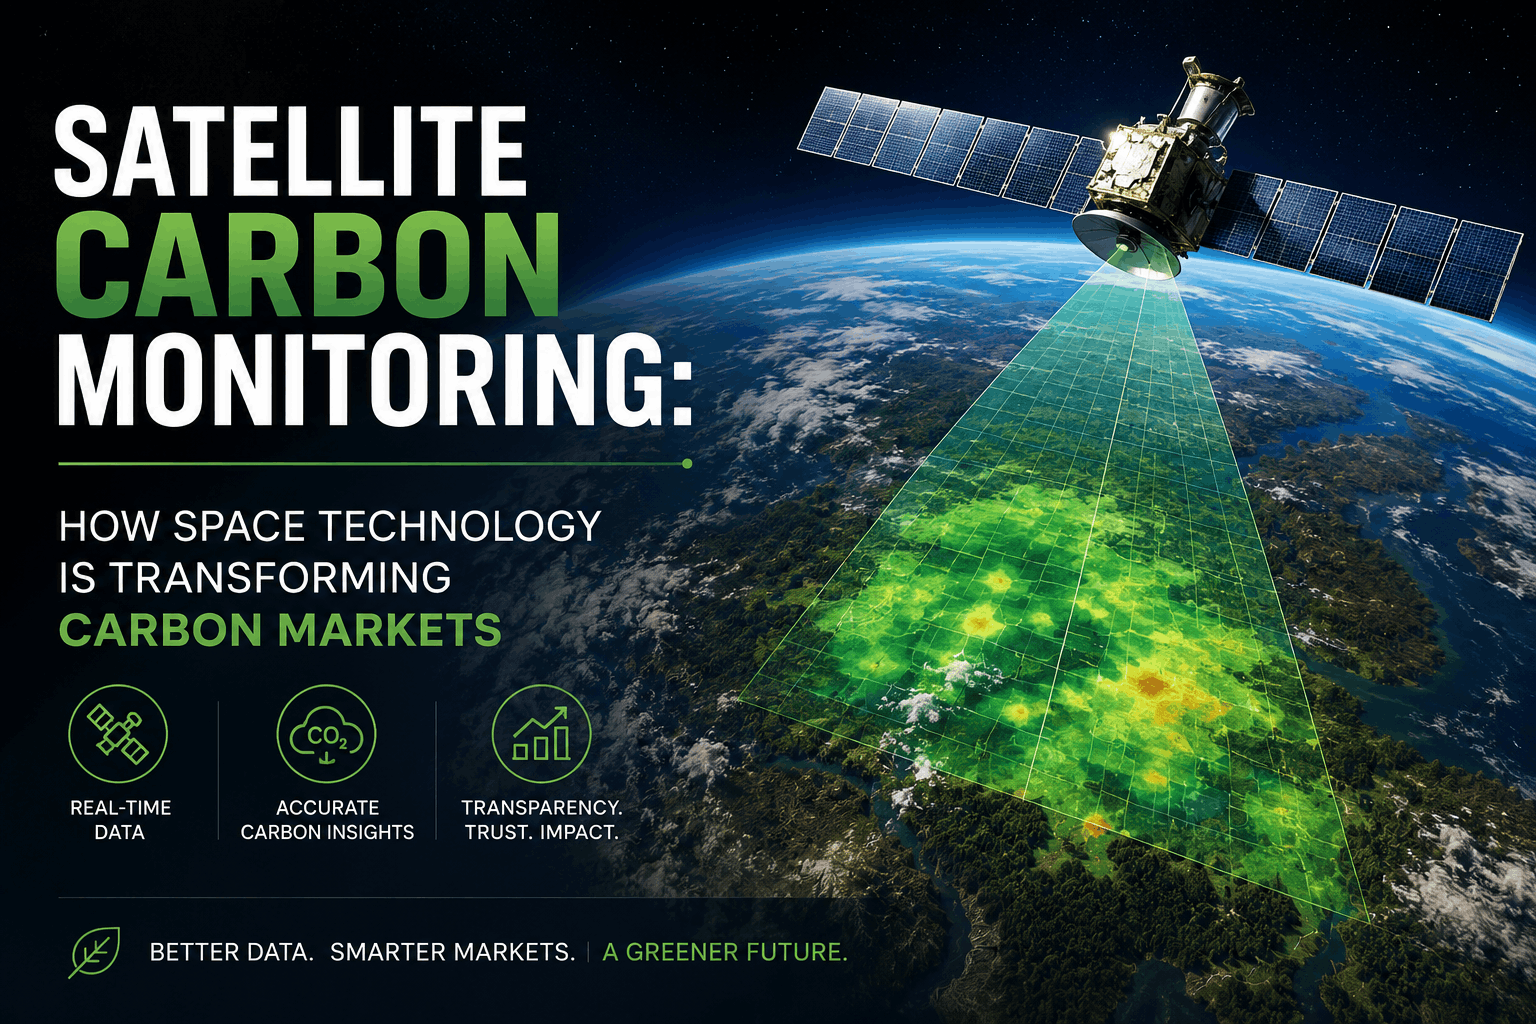
Every year, billions of dollars flow through carbon markets. Buyers purchase carbon credits expecting real, verified climate action. But how do we actually know the emissions reductions are real?
For decades, that question had a slow, expensive, and often unreliable answer: send someone on the ground to measure trees, check soil samples, and file reports. That system worked at small scale. At global scale, it breaks down fast.
That is where satellite carbon monitoring comes in.
Satellites now orbit the Earth at hundreds of kilometers above the ground, scanning forests, industrial facilities, oceans, and farmland. They detect greenhouse gas concentrations, track land cover changes, and measure methane plumes from oil fields and landfills in near real time.
This technology is not just a scientific curiosity. It is rapidly becoming the backbone of credible, scalable carbon markets.
In this article, you will learn exactly how satellite carbon monitoring works, which satellites are doing the heavy lifting, how it connects to carbon credit verification, what its limitations are, and where the technology is headed.
What Is Satellite Carbon Monitoring?
Satellite carbon monitoring refers to the use of Earth observation satellites to measure, track, and verify greenhouse gas (GHG) emissions and carbon stocks from space.
At its core, the goal is simple: understand how much carbon dioxide (CO2), methane (CH4), and other greenhouse gases are moving in and out of the atmosphere, and where.
Why Monitoring Carbon from Space Makes Sense
Ground-based monitoring networks exist, but they have huge gaps. There are thousands of ground stations worldwide, but they can only cover a fraction of the planet’s surface.
Satellites solve this problem by providing continuous, wide-area coverage. A single satellite pass can scan millions of square kilometers in hours.
The two main things satellite carbon monitoring tracks are:
- Atmospheric greenhouse gases: The concentration of CO2, CH4, and N2O directly in the air column above a location.
- Carbon stocks and land cover: How much carbon is locked in forests, soils, and vegetation, and how that changes over time.
Both are critical inputs for carbon market integrity.
Carbon Market Insider Newsletter
Weekly insights on carbon markets, climate policy, carbon credits, and sustainability.
Why Satellite Carbon Monitoring Matters for Carbon Markets
Carbon markets run on trust. A carbon credit represents one tonne of CO2 equivalent that has been reduced, avoided, or removed from the atmosphere.
For that credit to have real value, three things must be true:
- The emissions reduction actually happened.
- It would not have happened without the project (additionality).
- It is permanent and verifiable over time.
This is what the MRV framework (Monitoring, Reporting, and Verification) exists to prove.
The Problem with Traditional MRV
Traditional MRV relies heavily on on-the-ground measurements, field surveys, and self-reported data. That approach is:
- Slow: Field surveys can take months to complete and verify.
- Expensive: Sending auditors to remote forests in the Amazon or Congo Basin is costly.
- Inconsistent: Different auditors use different methodologies, creating data gaps.
- Easy to game: Projects have historically overstated their carbon sequestration with minimal real-time oversight.
The result has been serious scandals. Studies in 2023 and 2024 found that many prominent forest carbon projects overestimated their impact by a wide margin, triggering a crisis of confidence in voluntary carbon markets.
How Satellite Monitoring Changes the Equation
Satellite carbon monitoring tackles these weaknesses directly. It provides:
- Independent, third-party data that no project developer controls.
- Continuous monitoring rather than periodic snapshots.
- Global coverage at consistent resolution and methodology.
- Near real-time alerts when forests are cleared or emissions spike unexpectedly.
This shifts MRV from a trust-based system to a data-driven one.
How Does Satellite Carbon Monitoring Actually Work?
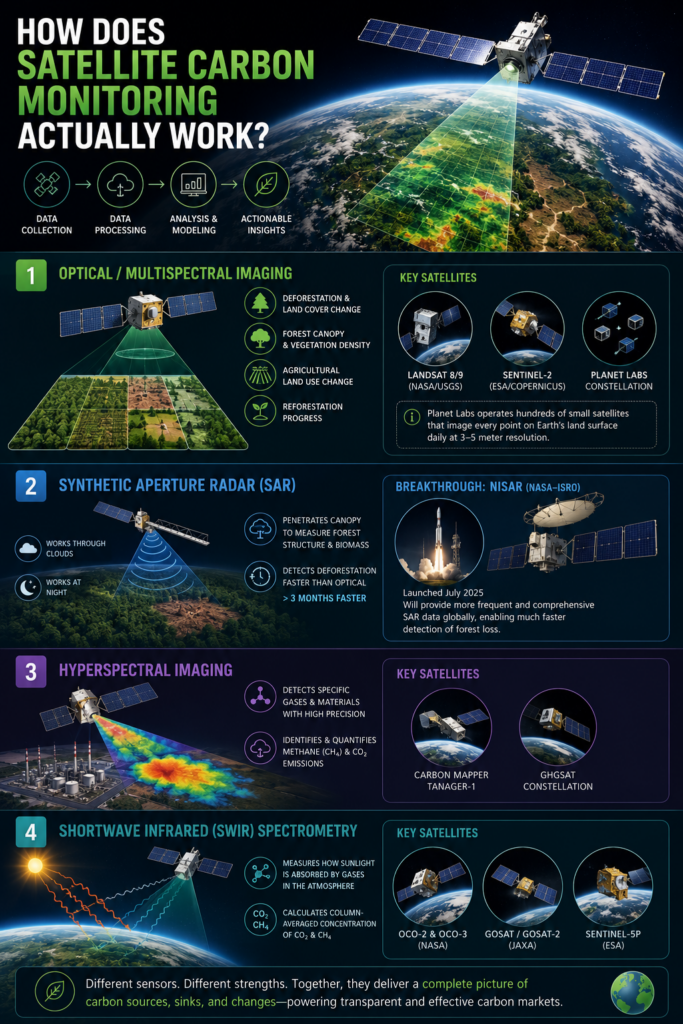
Satellites measure greenhouse gases and carbon stocks using a range of sensing technologies. Understanding the different methods helps clarify what each satellite can and cannot do.
1. Optical/Multispectral Imaging
Optical satellites capture visible light and near-infrared wavelengths reflected from the Earth’s surface. They work similarly to a very powerful camera.
These satellites are excellent for:
- Detecting deforestation and land cover change.
- Estimating forest canopy cover and vegetation density.
- Tracking agricultural land use changes.
- Monitoring reforestation and afforestation progress.
Key satellites: Landsat 8/9 (NASA/USGS), Sentinel-2 (ESA/Copernicus), Planet Labs’ constellation.
Planet Labs operates hundreds of small satellites that image every point on Earth’s land surface daily at 3-5 meter resolution. This allows near-continuous monitoring of forest projects at scale.
2. Synthetic Aperture Radar (SAR)
SAR satellites emit their own microwave radar pulses and measure what bounces back. Unlike optical sensors, SAR works through clouds and at night.
This is critical for tropical forests, which are often cloud-covered most of the year. SAR penetrates canopy cover and measures forest structure and biomass more accurately than optical alone.
A major breakthrough came in July 2025 with the launch of NISAR (NASA-ISRO Synthetic Aperture Radar). This joint NASA-ISRO mission will provide significantly more frequent and comprehensive SAR data globally, enabling much faster detection of forest loss. Research from NASA shows that SAR can detect deforestation alerts more than three months faster than optical sensors alone in some cases.
3. Hyperspectral Imaging
Hyperspectral sensors capture hundreds of narrow wavelength bands simultaneously. This allows them to identify specific gases and materials with high precision.
Hyperspectral satellites are the key technology for detecting methane plumes and CO2 emissions from specific industrial facilities. They can identify the chemical signature of a gas in the atmosphere and quantify its concentration.
Key satellites: Carbon Mapper’s Tanager-1, GHGSat’s constellation.
4. Shortwave Infrared (SWIR) Spectrometry
SWIR spectrometers measure how sunlight is absorbed by the atmosphere at specific wavelengths associated with CO2 and methane. By comparing incoming solar radiation with what reflects back, they can calculate the column-averaged concentration of these gases.
Key satellites: NASA’s OCO-2 and OCO-3, Japan’s GOSAT series, ESA’s Sentinel-5P.
Key Satellites in Carbon Monitoring Today
NASA Orbiting Carbon Observatory (OCO-2 and OCO-3)
OCO-2, launched in 2014, and OCO-3, attached to the International Space Station since 2019, measure atmospheric CO2 concentrations at high spatial resolution. They have been foundational to understanding global carbon flux patterns.
As of 2025, both missions are under threat. The Trump administration’s proposed NASA budget for FY2026 included plans to defund OCO-2 and OCO-3. Scientists and members of Congress have raised strong objections, arguing this would represent a major setback for global carbon monitoring infrastructure.
ESA Copernicus CO2 Monitoring Mission (CO2M)
The CO2M mission is being developed by ESA and the European Commission specifically to monitor anthropogenic (human-caused) CO2 emissions from space.
CO2M will carry a high-resolution imaging spectrometer measuring CO2, CH4, and NO2. A single satellite achieves an 11-day revisit cycle. Two satellites halve that. Three satellites will deliver full global coverage every 3 to 4 days.
In January 2025, ESA signed a €175.5 million contract for a third CO2M satellite, expanding the constellation and reducing the revisit time to approximately 3 days. This is a major step toward continuous, routine monitoring of national GHG emissions at a country level.
Carbon Mapper (Tanager-1)
Carbon Mapper is a nonprofit coalition backed by Planet Labs, NASA’s Jet Propulsion Laboratory, philanthropists, and state governments. Its Tanager-1 satellite launched on August 16, 2024, completed commissioning in January 2025, and entered full operational monitoring in 2025.
Tanager-1 carries a hyperspectral imaging spectrometer designed by NASA JPL. It locates and quantifies CH4 and CO2 “super emitters” at facility scale globally. These are point sources where emissions are unusually high, such as a leaking oil well, a malfunctioning industrial furnace, or a poorly managed landfill.
Carbon Mapper makes its data publicly available, a deliberate choice to ensure independent accountability and transparency across the carbon market.
GHGSat
GHGSat is the global leader in industrial greenhouse gas satellite monitoring. Based in Canada, it operates a growing constellation of small satellites with high-resolution sensors designed to detect methane emissions at individual facility level.
As of late 2025, GHGSat operates 16 satellites after launching two new ones (Teodor and Laila) during COP30 in November 2025. The company is on track to nearly double its constellation to 21 satellites by end of 2026, enabling daily revisit capability at industrial sites worldwide.
GHGSat detected over 20,000 methane leaks in 2024 alone. A landmark study published in the journal Science in December 2025 used the GHGSat constellation to create the first-ever global map of methane leaks from the energy sector, identifying emissions from more than 3,000 industrial sites. Coal mines emitted 48% of the time, while oil and gas sites leaked intermittently at 16% of monitored instances. Total methane detected in that single year reached 8.3 million tonnes.
Clients including ExxonMobil, Aramco, the UK Space Agency, and multiple UN organizations rely on GHGSat data to identify emissions hotspots and validate their reduction efforts.
ESA Sentinel-2 and Sentinel-5P (Copernicus Programme)
Sentinel-2 provides high-resolution multispectral imagery used extensively for forest monitoring, agricultural carbon tracking, and land use change detection.
Sentinel-5P carries the TROPOMI instrument, which measures atmospheric concentrations of methane, CO2, NO2, and other gases at global scale daily. It is the workhorse of atmospheric GHG monitoring in Europe’s Copernicus programme.
GOSAT and GOSAT-2 (JAXA, Japan)
Japan’s Greenhouse Gases Observing Satellite (GOSAT), launched in 2009, and its successor GOSAT-2 (2018) have provided over a decade of consistent global CO2 and methane data. GOSAT data has been used extensively to validate national GHG inventories and study carbon flux patterns across continents.
Planet Labs
Planet Labs operates one of the world’s largest satellite constellations, providing daily high-resolution imagery of virtually the entire Earth’s land surface. For carbon projects, Planet’s data enables broad-area land classification, monitoring of reforestation, detection of deforestation in real time, and estimation of above-ground carbon stocks at scale.
Satellite Carbon Monitoring and Carbon Credit Verification
This is where satellite technology directly meets the carbon market.
What Good MRV Requires
A credible carbon credit needs continuous, independent verification of:
- Baselines: What would have happened without the project?
- Additionality: Is the emission reduction genuinely new?
- Permanence: Is the carbon stored staying stored?
- Leakage: Are emissions simply moving somewhere else?
Satellites address all four when used properly.
Forest Carbon and REDD+ Projects
Forest carbon projects, including REDD+ (Reducing Emissions from Deforestation and Forest Degradation), are among the largest sources of carbon credits in voluntary markets.
Before satellites, verifying forest carbon meant periodic forest inventories by field teams. These were expensive, slow, and covered only a fraction of the project area.
Today, satellite data from Sentinel-2, Planet Labs, and Landsat can:
- Detect deforestation down to individual tree clusters within days of it happening.
- Map forest canopy cover and density across millions of hectares.
- Track reforestation and natural regeneration progress over years.
- Flag potential leakage by monitoring areas surrounding the project boundary.
SAR data adds another layer by seeing through cloud cover and measuring canopy structure and biomass, which optical satellites miss.
The SatMRV platform, supported by ESA, uses Sentinel-2, Sentinel-1, and Landsat-8/9 data specifically to map and monitor soil organic carbon for agricultural carbon farming projects. It provides protocol-compliant MRV data to carbon credit project developers, making it easier to certify credits under international standards like Verra’s Verified Carbon Standard.
Methane Credit Verification
Methane is roughly 80 times more potent than CO2 as a warming agent over a 20-year period. Reducing methane emissions is one of the fastest climate levers available.
Satellite monitoring of methane creates a new class of verifiable carbon credits:
- Oil and gas companies can earn credits by demonstrating they have detected and repaired methane leaks, using GHGSat or Carbon Mapper data as independent verification.
- Landfill operators can monitor fugitive methane emissions and demonstrate reductions.
- Agricultural projects reducing enteric fermentation emissions from livestock can use satellite-plus-sensor data to quantify and verify reductions.
The key shift here is that satellite data provides independent third-party evidence that no project developer controls. This dramatically raises the credibility of methane reduction credits.
Digital MRV (dMRV): The New Standard
The carbon market is moving rapidly toward Digital MRV (dMRV), which integrates satellite data with ground sensors, IoT devices, AI-powered analysis, and blockchain-based registries.
dMRV replaces manual, sample-based monitoring with continuous, digital verification. This means:
- Baselines are established from multi-year satellite data archives rather than estimated from limited field surveys.
- Ongoing monitoring runs automatically with satellite passes triggering alerts if anomalies are detected.
- Verification is faster and cheaper because the data is already collected and processed.
- Audit trails are immutable and publicly accessible.
As a framework, dMRV strengthens compliance with registries like Verra and Gold Standard, as well as regulatory frameworks like the EU Deforestation Regulation (EUDR).
Real-World Examples of Satellite Carbon Monitoring in Action
The Amazon Deforestation Crisis
The Amazon rainforest stores enormous quantities of carbon. Deforestation threatens to release that carbon and destroy one of Earth’s most important carbon sinks.
Brazil’s INPE (National Institute for Space Research) has operated satellite-based Amazon deforestation monitoring systems, PRODES and DETER, for decades. DETER provides near-real-time alerts when deforestation is detected, enabling authorities to respond quickly.
This system has been foundational to REDD+ crediting in Brazil and shows how satellite monitoring can support both policy enforcement and carbon market crediting simultaneously.
Methane Leaks at Turkmenistan Oil Fields
One of the most dramatic early demonstrations of satellite methane monitoring came from Central Asia. Satellites detected enormous methane plumes from oil and gas infrastructure in Turkmenistan that were far larger than what the country officially reported.
This kind of independent atmospheric data is impossible to fake. It cannot be explained away by a project developer because it is measured directly in the atmosphere above the source. This data directly influenced international pressure for better disclosure and leak repair programs.
Coal Mine Emissions in China
The GHGSat global methane study published in Science (December 2025) found that coal mines were among the most persistent emitters, releasing methane 48% of the time on average. Chinese coal mines represented a major portion of detected emissions.
This data is now being used by financial institutions and carbon market participants to assess the climate credibility of coal companies’ net-zero pledges and to structure methane reduction incentives and credits.
Soil Carbon Farming in Australia
Australian farms participating in carbon credit programs under the Australian Carbon Credit Unit (ACCU) scheme need to prove soil carbon increases over time. Traditional soil sampling is expensive and covers only a fraction of a farm’s area.
Satellite-based soil organic carbon monitoring, using ESA Sentinel data combined with machine learning, now allows much broader coverage at lower cost. SatMRV and similar platforms provide carbon farmers with satellite-derived SOC maps that meet registry requirements for credit issuance.
How Satellite Data Catches Greenwashing in Carbon Markets
One of the most powerful applications of satellite carbon monitoring is detecting fraud and greenwashing in carbon credit projects.
Common Fraud Patterns Satellites Can Detect
Phantom forests: Projects claim to protect forests that were never at risk, or that have already been destroyed. Satellite historical imagery archives going back decades expose this quickly.
Boundary manipulation: Project developers draw project boundaries to include protected areas where deforestation would never have happened anyway, inflating their baseline. Satellite land cover mapping makes this much harder to get away with.
Leakage hiding: A project reduces deforestation inside its boundary but deforestation simply shifts to nearby areas. Satellite monitoring of the surrounding landscape can detect this pattern.
Credit inflation: Projects overestimate the biomass and carbon density of their forests. Combining optical satellite imagery with SAR data and LiDAR (where available) provides independent biomass estimates that auditors can compare against project claims.
Independent Rating Platforms
Companies like Sylvera now combine advanced remote sensing technology including satellite imagery, multi-scale LiDAR, machine learning, and field validation to provide independent ratings of carbon credit quality.
This means carbon credit buyers can now access satellite-derived quality scores before purchasing credits, greatly reducing their risk of buying low-quality or fraudulent offsets.
Challenges and Limitations of Satellite Carbon Monitoring
Satellite carbon monitoring is powerful, but it is not perfect. Understanding its limitations is important for using it responsibly.
Cloud Cover
Optical satellites cannot see through clouds. This is a serious problem in tropical regions like the Amazon and Congo Basin, where persistent cloud cover can block visibility for weeks or months.
Solutions include combining optical data with SAR (which works in all weather) and using data from multiple satellite passes to build cloud-free composites over time. Planet Labs’ global cloud-free monthly mosaics are an example of this approach.
Spatial Resolution vs. Coverage Trade-offs
High-resolution satellites can identify individual tree clusters and facility-level emissions, but they cover smaller areas and have less frequent revisit times. Coarser satellites cover the whole planet more frequently but miss smaller-scale changes.
The trend in satellite technology is steadily toward higher resolution at higher revisit frequency. Planned constellations and next-generation instruments will largely resolve this trade-off over the next decade.
Below-Ground Carbon
Satellites measure above-ground biomass well. They cannot directly measure below-ground carbon, soil organic carbon, or carbon in wetlands and peatlands.
For soil carbon projects, satellite data must be combined with ground sampling and modelling. Platforms like SatMRV address this by integrating satellite imagery with soil databases, weather models, and calibrated field samples.
Detecting Forest Degradation vs. Deforestation
Detecting complete deforestation is relatively straightforward with optical satellites. Detecting gradual forest degradation (selective logging, subtle canopy thinning) is much harder.
Innovative approaches like InSAR (Interferometric SAR), which detects changes in forest canopy height from radar signals, are showing promise for measuring forest degradation at scale. LiDAR from airborne and spaceborne platforms adds further precision.
Algorithm and Retrieval Errors
Processing satellite data into GHG concentration measurements involves complex algorithms that can introduce errors, especially in regions with high aerosol loads, industrial pollution, or complex terrain. Research is actively ongoing to reduce these biases.
Data Access and Interpretation
Satellite data is only useful if stakeholders can access and interpret it. For project developers in developing countries, lack of technical capacity to work with satellite data remains a genuine barrier.
The rise of managed platforms and services (SatMRV, Carbon Mapper’s public data portal, Planet’s forest monitoring services) is addressing this by turning raw satellite data into accessible, decision-ready information.
The Role of AI and Machine Learning in Satellite Carbon Monitoring
Satellites collect enormous volumes of data. Processing that data into actionable insights requires artificial intelligence and machine learning.
Key AI applications in satellite carbon monitoring include:
- Change detection algorithms that automatically flag deforestation events within days of a satellite pass.
- Biomass estimation models that combine multispectral and SAR data to map above-ground carbon stocks.
- Methane plume detection algorithms that identify emission signatures in hyperspectral imagery.
- Anomaly detection that alerts project developers and auditors when monitored areas show unexpected changes.
- Cross-validation systems that compare satellite observations against ground sensor data, atmospheric models, and historical records to improve accuracy.
The combination of satellite data and AI is what makes dMRV scalable. Without AI, humans cannot process the volume of data that satellite constellations produce. With AI, the entire Earth can be monitored continuously.
Satellite Carbon Monitoring and the Compliance Carbon Market
Satellite monitoring is not just for voluntary carbon markets. Compliance markets are increasingly incorporating satellite data.
Article 6 of the Paris Agreement
Article 6 enables countries to trade carbon units internationally. For this to work without double-counting, both the country selling credits and the country buying them must apply corresponding adjustments to their national inventories.
Accurate national GHG inventories are essential for this. Satellite data provides an independent cross-check on reported national inventories, making double-counting and fraudulent reporting much harder.
EU Carbon Border Adjustment Mechanism (CBAM)
The EU’s CBAM requires importers to pay for the carbon embedded in certain goods. Accurate measurement of embedded emissions across global supply chains will increasingly rely on satellite-derived emissions data combined with trade data and company-level reporting.
India’s Carbon Credit Trading Scheme (CCTS)
India launched its Carbon Credit Trading Scheme to create a domestic compliance carbon market. As the scheme scales, satellite monitoring will be critical for verifying the emissions reductions that generate tradable credits, particularly in forestry, agriculture, and industrial sectors.
What’s Next: The Future of Satellite Carbon Monitoring
The pace of development in satellite carbon monitoring is accelerating rapidly. Here is what to watch for through the rest of the 2020s.
ESA CO2M Launch and Operation
The first two CO2M satellites are scheduled to launch in the mid-2020s, with the third following. Once operational, CO2M will provide the world’s most comprehensive routine monitoring of anthropogenic CO2 emissions at national and sub-national scale. This will be transformational for verifying country-level climate pledges (NDCs).
GHGSat Daily Revisit Constellation
With its planned fleet of 21+ satellites by end of 2026, GHGSat aims for daily revisit capability at industrial sites globally. This moves methane monitoring from periodic snapshots to continuous surveillance, making it far harder for facilities to hide emissions.
Hyperspectral Constellations
The success of Carbon Mapper’s Tanager-1 is likely to spur further investment in hyperspectral satellite constellations. Multiple Tanager satellites would provide even more frequent facility-scale GHG mapping globally.
GeoCarb, a proposed geostationary carbon observatory, could eventually provide hourly monitoring of CO2, methane, and CO from a fixed vantage point over the Americas.
AI-Powered Automated MRV Pipelines
The integration of satellite data with AI-powered processing, IoT sensors, and blockchain-based registries will increasingly automate MRV workflows. Projects that today take months to audit may be verified in days or weeks.
This will dramatically lower the cost of high-quality MRV, opening the carbon market to smaller projects and developing country participants who are currently priced out by expensive manual verification.
Greater Standardization of Satellite Data in Carbon Standards
Registries like Verra, Gold Standard, and national bodies are actively developing methodologies that formally accept satellite-derived data as primary evidence for carbon credit issuance and verification.
As these methodologies mature and are adopted, satellite carbon monitoring will shift from a supplementary tool to a required component of credible carbon projects.
How Satellite Monitoring Builds Buyer Confidence in Carbon Credits
For companies buying carbon credits, satellite monitoring offers a powerful quality signal.
What to look for when evaluating carbon credits:
- Does the project use satellite monitoring as part of its MRV? Projects that rely solely on self-reported field data carry higher integrity risk.
- Is the satellite data from an independent provider? Data from Carbon Mapper, Planet Labs, GHGSat, or Copernicus satellites is independent of the project developer.
- Does the project have a historical satellite baseline? Multi-year archives prove the baseline was set accurately before the project started.
- Is real-time monitoring and alerting in place? The best projects provide continuous monitoring with alerts for unexpected changes.
- Has the satellite data been cross-validated with ground measurements? A combination of satellite and field data provides the strongest verification.
- Does an independent rating service (like Sylvera) assess the project using satellite data? Independent ratings add another layer of assurance.
Buyers who apply these criteria dramatically reduce their exposure to low-quality or fraudulent carbon credits.
Frequently Asked Questions (FAQs)
Q1: What is satellite carbon monitoring? Satellite carbon monitoring uses Earth observation satellites to measure greenhouse gas concentrations in the atmosphere, track carbon stocks in forests and soils, and verify emissions reductions for carbon markets. It provides independent, large-scale, continuous data that traditional ground-based methods cannot match.
Q2: How do satellites measure CO2 and methane from space? Satellites use spectrometers to measure how sunlight interacts with gases in the atmosphere. Different gases absorb light at specific wavelengths. By analyzing the spectrum of reflected sunlight, satellites can calculate the concentration of CO2, methane, and other greenhouse gases in the atmospheric column below them.
Q3: Which satellites are used for carbon monitoring? Key satellites include NASA’s OCO-2 and OCO-3, Japan’s GOSAT/GOSAT-2, ESA’s Sentinel-2 and Sentinel-5P, the upcoming CO2M constellation, GHGSat’s constellation of 16+ small satellites, Carbon Mapper’s Tanager-1, and Planet Labs’ high-resolution imaging constellation.
Q4: How does satellite data help carbon credit verification? Satellite data provides independent, continuous evidence that forests are still standing, that reforestation is progressing, that deforestation is not leaking to adjacent areas, and that industrial facilities are reducing their emissions as claimed. This replaces or supplements expensive, slow field audits with objective, scalable data.
Q5: Can satellites detect deforestation in real time? Yes. Platforms like Brazil’s DETER system and Planet Labs’ daily imaging can detect deforestation events within days. SAR satellites like NISAR (launched July 2025) can detect forest loss through cloud cover, potentially giving alerts three months faster than optical sensors alone in some contexts.
Q6: What is the difference between satellite carbon monitoring and ground-based monitoring? Ground-based monitoring uses field surveys, soil sampling, flux towers, and direct measurements at specific locations. It is accurate but limited in spatial coverage and expensive at scale. Satellite monitoring covers vast areas continuously at lower cost per unit area, but requires ground calibration to ensure accuracy. The best systems combine both.
Q7: What are the limitations of satellite carbon monitoring? Key limitations include the inability of optical satellites to see through cloud cover, difficulty measuring below-ground soil carbon, challenges distinguishing forest degradation from deforestation, algorithm errors in high-aerosol environments, and the need for technical expertise to interpret the data. These limitations are being progressively addressed through SAR, multi-sensor fusion, AI, and managed data platforms.
Q8: Is satellite monitoring enough on its own to verify carbon credits? Not yet in most cases. Satellite data is most powerful when combined with ground sensor data, field validation, and AI-powered analysis. Most credible MRV frameworks today use satellite data as the primary evidence layer, supplemented by ground truth. As satellite resolution and methodology improve, the reliance on field validation will decrease.
Q9: How does satellite monitoring help prevent greenwashing? Satellite data creates an independent record that no project developer can alter. Historical imagery archives expose false baselines. Real-time monitoring detects deforestation as it happens. Facility-level methane tracking catches emission reductions that were claimed but never implemented. Combined with independent rating services, this makes it far harder for low-quality projects to pass as credible.
Q10: What is digital MRV (dMRV)? Digital MRV (dMRV) is the use of digital technologies, including satellite monitoring, geospatial mapping, AI, IoT sensors, and blockchain, to measure, report, and verify carbon emissions reductions. It replaces slow, manual, sample-based MRV with continuous, scalable, and auditable digital verification. dMRV is increasingly seen as the standard for high-integrity carbon markets.
Conclusion
Satellite carbon monitoring is not a future technology. It is here now, and it is already reshaping how carbon markets operate.
From detecting deforestation in the Amazon to pinpointing methane leaks at oil wells in Central Asia to verifying soil carbon increases on Australian farms, satellites provide the independent, continuous, global-scale evidence that credible carbon markets require.
The technology is advancing fast. GHGSat is expanding toward a 21-satellite constellation with daily revisit capability. Carbon Mapper’s Tanager-1 is delivering hyperspectral point-source data to the public. ESA’s CO2M mission will soon provide near-daily monitoring of national-level CO2 emissions. NISAR is accelerating forest loss detection globally.
Combined with AI-powered analysis, digital MRV platforms, and evolving registry standards, satellite carbon monitoring is moving from a supplementary tool to a foundational requirement of credible carbon credit markets.
For anyone working in or buying from carbon markets, understanding satellite carbon monitoring is no longer optional. It is core knowledge for navigating a market that is moving toward higher integrity, greater transparency, and satellite-backed accountability.
The atmosphere cannot lie. And now, from hundreds of kilometers above the Earth, we finally have the tools to read what it is telling us.